Package dalex
dalex: Responsible Machine Learning in Python
![]()

![]()
Overview
Unverified black box model is the path to the failure. Opaqueness leads to distrust. Distrust leads to ignoration. Ignoration leads to rejection.
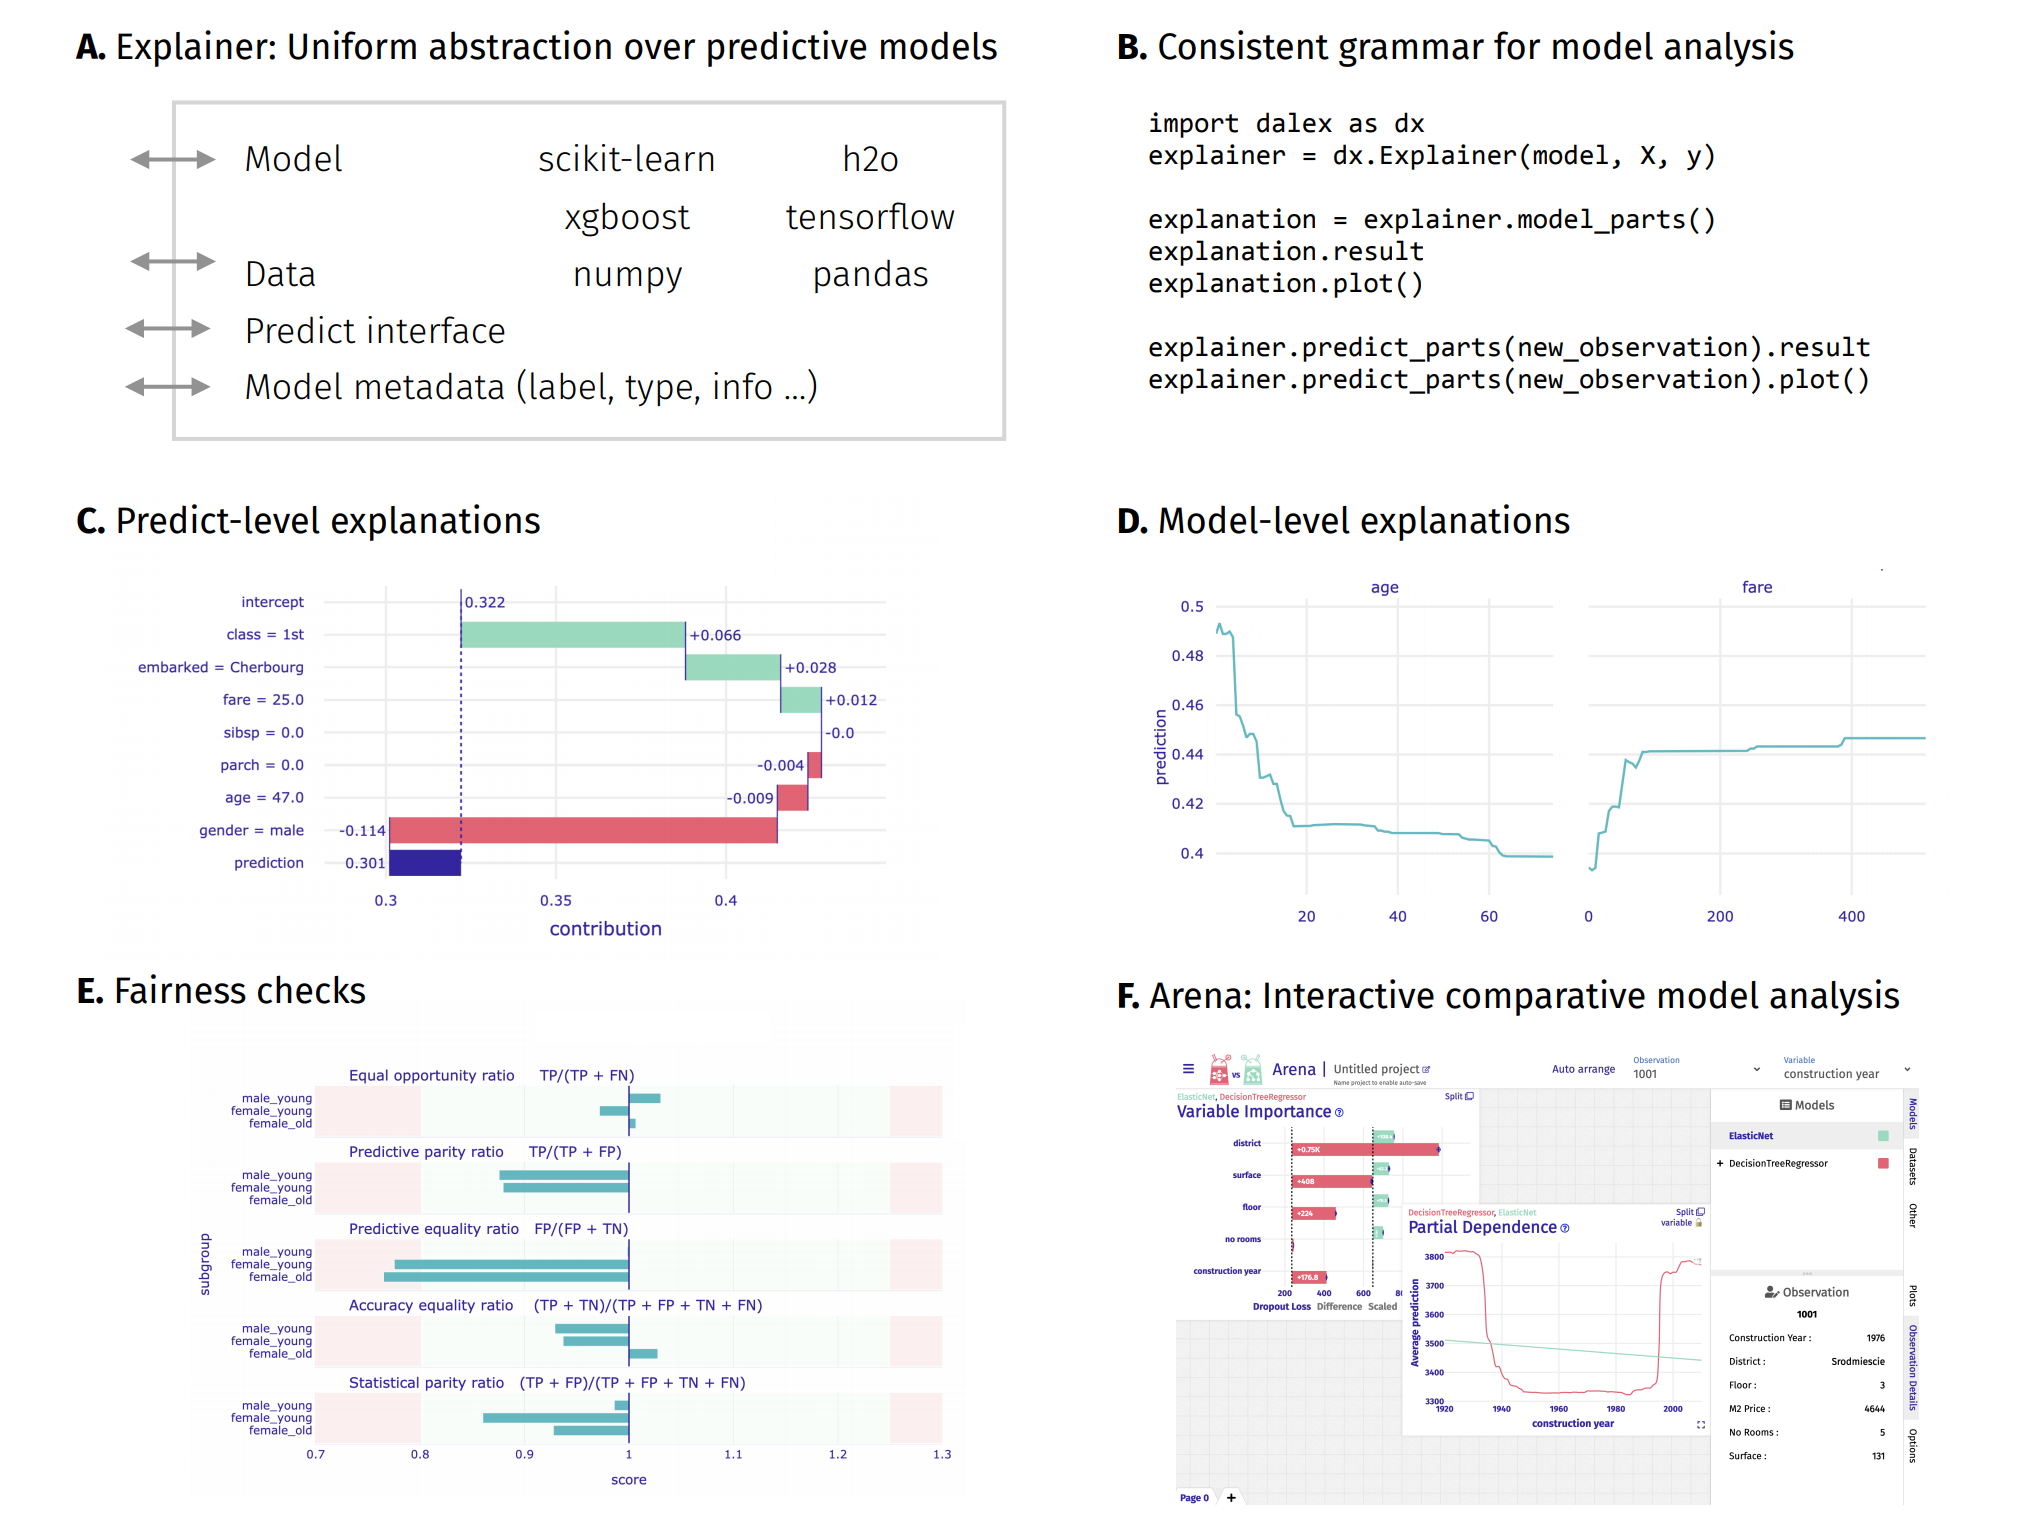
The dalex package xrays any model and helps to explore and explain its behaviour, helps to understand how complex models are working.
The main Explainer object creates a wrapper around a predictive model. Wrapped models may then be explored and compared with a collection of model-level and predict-level explanations. Moreover, there are fairness methods and interactive exploration dashboards available to the user.
The philosophy behind dalex explanations is described in the Explanatory Model Analysis book.
Installation
The dalex package is available on PyPI and conda-forge.
pip install dalex -U

conda install -c conda-forge dalex
One can install optional dependencies for all additional features using pip install dalex[full].
Examples
- Introduction to the
dalexpackage: Titanic: tutorial and examples - Key features explained: FIFA20: explain default vs tuned model with dalex
- How to use dalex with: xgboost, tensorflow, h2o (feat. autokeras, catboost, lightgbm)
- More explanations: residuals, shap, lime
- Introduction to the Fairness module in dalex
- Tutorial on bias detection with dalex
- Introduction to the Aspect module in dalex
- Introduction to the Arena module in dalex
- Arena documentation: Getting Started & Demos
- Code in the form of jupyter notebook
Plots
This package uses plotly to render the plots:
- Install extensions to use
plotlyin JupyterLab: Getting Started Troubleshooting - Use
show=Falseparameter inplotmethod to returnplotly Figureobject - It is possible to edit the figures and save them
Citation
If you use dalex, please cite our JMLR paper:
@article{JMLR:v22:20-1473,
  author  = {Hubert Baniecki and
             Wojciech Kretowicz and
             Piotr Piatyszek and
             Jakub Wisniewski and
             Przemyslaw Biecek},
  title   = {dalex: Responsible Machine Learning
             with Interactive Explainability and Fairness in Python},
  journal = {Journal of Machine Learning Research},
  year    = {2021},
  volume  = {22},
  number  = {214},
  pages   = {1-7},
  url     = {http://jmlr.org/papers/v22/20-1473.html}
}
Developer
There is a detailed instruction on how to add native support for a new model/framework into dalex, and how to add a new explanation method.
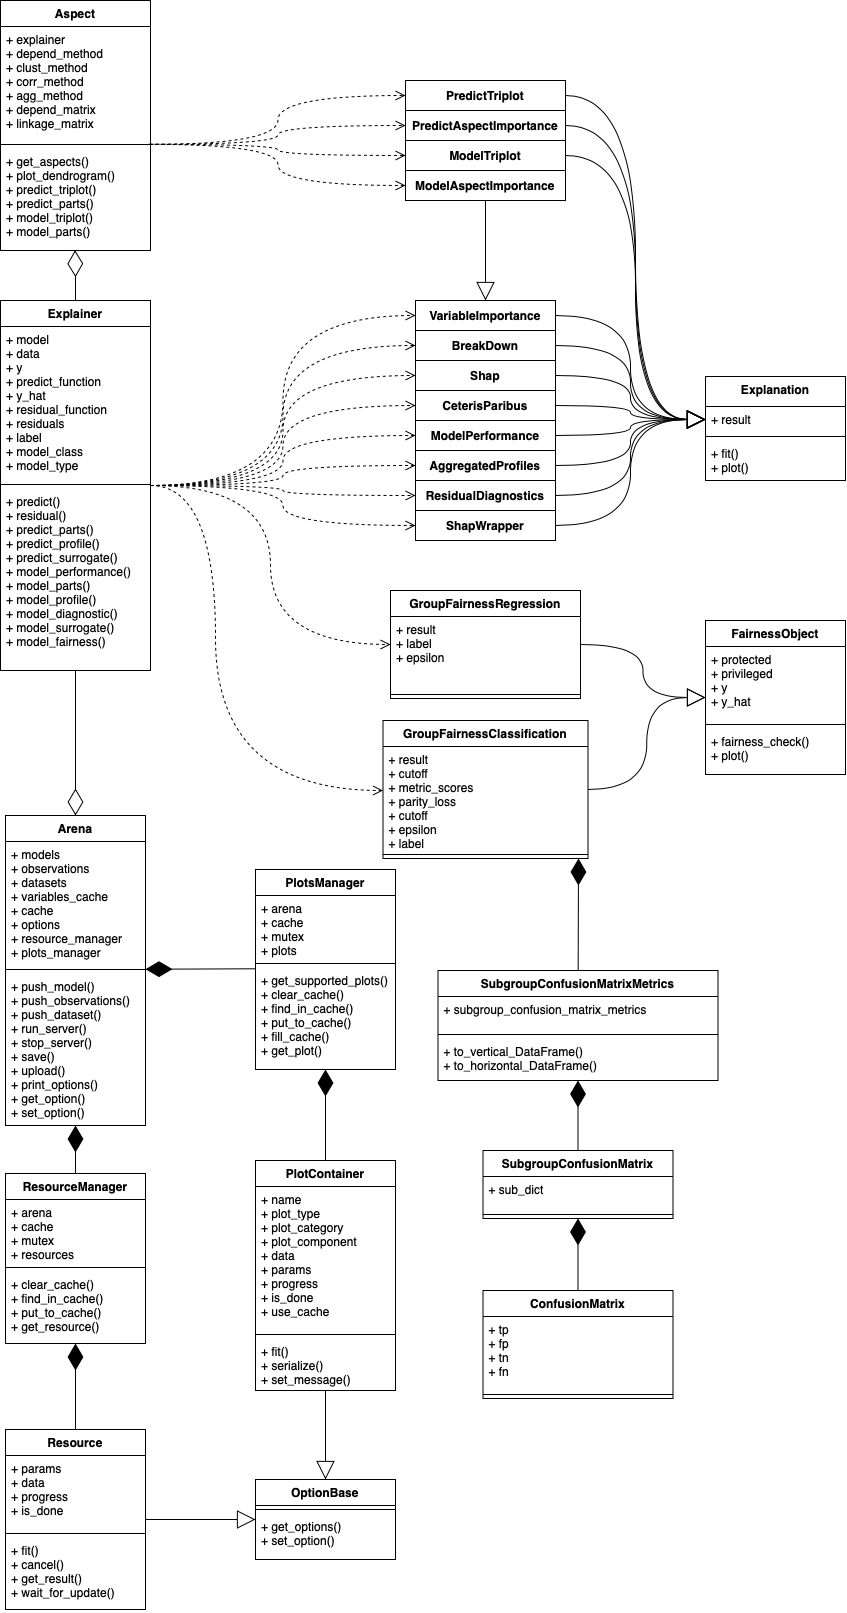
Class diagram (v1.4.0)
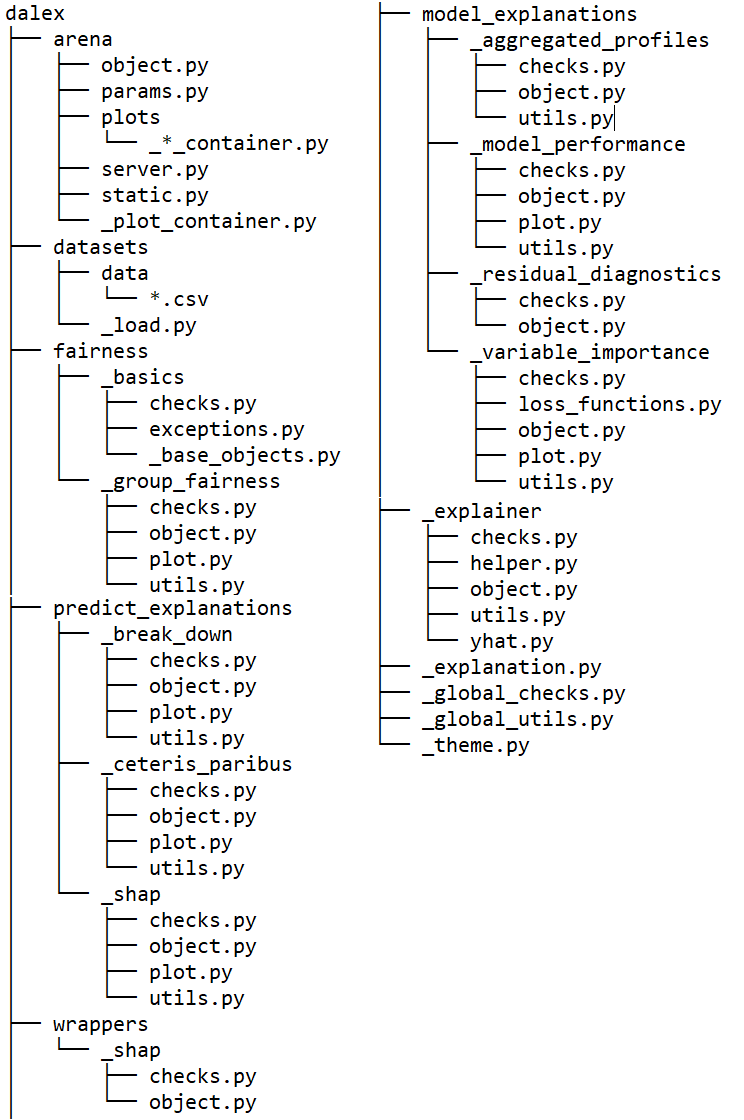
Folder structure (v1.3.0)
Expand source code Browse git
"""
.. include:: ./documentation.md
"""


from . import datasets
from ._explainer.object import Explainer
from .arena.object import Arena
from .aspect import Aspect


__version__ = '1.4.0'

__all__ = [
  "Arena",
  "Aspect",
  "datasets",
  "Explainer",
  "fairness"
]

# specify autocompletion in IPython
# see comment: https://github.com/ska-telescope/katpoint/commit/ed7e8b9e389ee035073c62c2394975fe71031f88
# __dir__ docs (Python 3.7!): https://docs.python.org/3.7/library/functions.html#dir


def __dir__():
    """IPython tab completion seems to respect this."""
    return __all__ + [
        "__all__",
        "__builtins__",
        "__cached__",
        "__doc__",
        "__file__",
        "__loader__",
        "__name__",
        "__package__",
        "__path__",
        "__spec__",
        "__version__",
    ]
Sub-modules
dalex.arenadalex.aspectdalex.datasetsdalex.fairnessdalex.model_explanationsdalex.predict_explanationsdalex.wrappers
Classes
class Arena (precalculate=False, enable_attributes=True, enable_custom_params=True, verbose=True)-
Creates Arena object
This class should be used to create Python connector for Arena dashboard. Initialized object can work both in static and live mode. Use
push_*methods to add your models, observations and datasets.Parameters
precalculate:bool- Enables precalculating plots after using each
push_*method. enable_attributes:bool- Enables attributes of observations and variables. Attributes are required to display details of observation in Arena, but it also increases generated file size.
enable_custom_params:bool- Enables modififying observations in dashboard. It requires attributes and works only in live version.
verbose:bool- Enables printing progresss of computations
Attributes
models:listofModelParam objects- List of pushed models encapsulated in ModelParam class
observations:listofObservationParam objects- List of pushed observations encapsulated in ObservationParam class
datasets:listofDatasetParam objects- List of pushed datasets encapsulated in DatasetParam class
variables_cache:listofVariableParam objects- Cached list of VariableParam objects generated using pushed models and datasets
server_thread:threading.Thread- Thread of running server or None otherwise
precalculate:bool- if plots should be precalculated
enable_attributes:bool- if attributes are enabled
enable_custom_params:bool- if modifying observations is enabled
timestamp:float- timestamp of last modification
mutex:_thread.lock- Mutex for params, plots and resources cache. Common to Arena, PlotsManager and ResourcesManager class.
options:dict- Options for plots
resource_manager:ResourceManager- Object responsible for managing resources
plots_manager:PlotsManager- Object responsible for managing plots
verbose:bool- If progress of computations should be displayed
Notes
For tutorial look at https://arena.drwhy.ai/docs/guide/first-datasource
Expand source code Browse git
class Arena:
    """ Creates Arena object

    This class should be used to create Python connector for Arena dashboard. Initialized
    object can work both in static and live mode. Use `push_*` methods to add your
    models, observations and datasets.

    Parameters
    ----------
    precalculate : bool
        Enables precalculating plots after using each `push_*` method.
    enable_attributes : bool
        Enables attributes of observations and variables. Attributes are required to
        display details of observation in Arena, but it also increases generated
        file size.
    enable_custom_params : bool
        Enables modififying observations in dashboard. It requires attributes and works
        only in live version.
    verbose : bool
        Enables printing progresss of computations

    Attributes
    --------
    models : list of ModelParam objects
        List of pushed models encapsulated in ModelParam class
    observations : list of ObservationParam objects
        List of pushed observations encapsulated in ObservationParam class
    datasets : list of DatasetParam objects
        List of pushed datasets encapsulated in DatasetParam class
    variables_cache : list of VariableParam objects
        Cached list of VariableParam objects generated using pushed models and datasets
    server_thread : threading.Thread
        Thread of running server or None otherwise
    precalculate : bool
        if plots should be precalculated
    enable_attributes : bool
        if attributes are enabled
    enable_custom_params : bool
        if modifying observations is enabled
    timestamp : float
        timestamp of last modification
    mutex : _thread.lock
        Mutex for params, plots and resources cache. Common to Arena, PlotsManager and ResourcesManager class.
    options : dict
        Options for plots
    resource_manager: ResourceManager
        Object responsible for managing resources
    plots_manager: PlotsManager
        Object responsible for managing plots
    verbose : bool
        If progress of computations should be displayed

    Notes
    --------
    For tutorial look at https://arena.drwhy.ai/docs/guide/first-datasource

    """
    def __init__(self, precalculate=False, enable_attributes=True, enable_custom_params=True, verbose=True):
        self.mutex = threading.Lock()
        self.models = []
        self.observations = []
        self.datasets = []
        self.variables_cache = []
        self.resource_manager = ResourceManager(self)
        self.plots_manager = PlotsManager(self)
        self.server_thread = None
        self.precalculate = bool(precalculate)
        self.enable_attributes = bool(enable_attributes)
        self.enable_custom_params = bool(enable_custom_params)
        self.verbose = bool(verbose)
        self.timestamp = datetime.timestamp(datetime.now())
        self.options = {}
        for x in (self.plots_manager.plots + self.resource_manager.resources):
            options = self.options.get(x.options_category) or {}
            for o in x.options.keys():
                options[o] = {'value': x.options.get(o).get('default'), 'desc': x.options.get(o).get('desc')}
            self.options[x.options_category] = options

    def get_supported_plots(self):
        """Returns plots classes that can produce at least one valid chart for this Arena.

        Returns
        -----------
        List of classes extending PlotContainer
        """
        return self.plots_manager.get_supported_plots()

    def run_server(self,
                   host='127.0.0.1',
                   port=8181,
                   append_data=False,
                   arena_url='https://arena.drwhy.ai/',
                   disable_logs=True):
        """Starts server for live mode of Arena

        Parameters
        -----------
        host : str
            ip or hostname for the server
        port : int
            port number for the server
        append_data : bool
            if generated link should append data to already existing Arena window.
        arena_url : str
            URl of Arena dhasboard
        disable_logs : str
            if logs should be muted

        Notes
        --------
        Read more about data sources https://arena.drwhy.ai/docs/guide/basic-concepts

        Returns
        -----------
        Link to Arena
        """
        if self.server_thread:
            raise Exception('Server is already running. To stop ip use arena.stop_server().')
        global_check_import('flask')
        global_check_import('flask_cors')
        global_check_import('requests')
        self.server_thread = threading.Thread(target=start_server, args=(self, host, port, disable_logs))
        self.server_thread.start()
        if append_data:
            print(arena_url + '?append=http://' + host + ':' + str(port) + '/')
        else:
            print(arena_url + '?data=http://' + host + ':' + str(port) + '/')

    def stop_server(self):
        """Stops running server"""
        if not self.server_thread:
            raise Exception('Server is not running')
        self._stop_server()
        self.server_thread.join()
        self.server_thread = None

    def update_timestamp(self):
        """Updates timestamp

        Notes
        -------
        This function must be called from mutex context
        """
        now = datetime.now()
        self.timestamp = datetime.timestamp(now)

    def push_model(self, explainer, precalculate=None):
        """Adds model to Arena

        This method encapsulate explainer in ModelParam object and
        save appends models fields. When precalculation is enabled
        triggers filling cache.

        Parameters
        -----------
        explainer : dalex.Explainer
            Explainer created using dalex package
        precalculate : bool or None
            Overrides constructor `precalculate` parameter when it is not None.
            If true, then only plots using this model will be precalculated.
        """
        if not isinstance(explainer, Explainer):
            raise Exception('Invalid Explainer argument')
        if explainer.label in self.list_params('model'):
            raise Exception('Explainer with the same label was already added')
        precalculate = self.precalculate if precalculate is None else bool(precalculate)
        param = ModelParam(explainer)
        with self.mutex:
            self.update_timestamp()
            self.models.append(param)
            self.variables_cache = []
        if precalculate:
            self.plots_manager.fill_cache({'model': param})

    def push_observations(self, observations, precalculate=None):
        """Adds observations to Arena

        Pushed observations will be used to local explainations. Function
        creates ObservationParam object for each row of pushed dataset. Label
        for each observation is taken from row name. When precalculation
        is enabled triggers filling cache.

        Parameters
        -----------
        observations : pandas.DataFrame
            Data frame of observations to be explained using instance level plots.
            Label for each observation is taken from row name.
        precalculate : bool or None
            Overrides constructor `precalculate` parameter when it is not None.
            If true, then only plots using thease observations will be precalculated.
        """
        if not isinstance(observations, DataFrame):
            raise Exception('Observations argument is not a pandas DataFrame')
        if len(observations.index.names) != 1:
            raise Exception('Observations argument need to have only one index')
        if not observations.index.is_unique:
            raise Exception('Observations argument need to have unique indexes')
        precalculate = self.precalculate if precalculate is None else bool(precalculate)
        old_observations = self.list_params('observation')
        observations = observations.set_index(observations.index.astype(str))
        params_objects = []
        for x in observations.index:
            if x in old_observations:
                raise Exception('Indexes of observations need to be unique across all observations')
            params_objects.append(ObservationParam(dataset=observations, index=x))
        with self.mutex:
            self.update_timestamp()
            self.observations.extend(params_objects)
        if precalculate:
            for obs in params_objects:
                self.plots_manager.fill_cache({'observation': obs})

    def push_dataset(self, dataset, target, label, precalculate=None):
        """Adds dataset to Arena

        Pushed dataset will visualised using exploratory data analysis plots.
        Function creates DatasetParam object with specified label and target name.
        When precalculation is enabled triggers filling cache.

        Parameters
        -----------
        dataset : pandas.DataFrame
            Data frame to be visualised using EDA plots. This
            dataset should contain target variable.
        target : str
            Name of target column
        label : str
            Label for this dataset
        precalculate : bool or None
            Overrides constructor `precalculate` parameter when it is not None.
            If true, then only plots using this model will be precalculated.
        """
        if not isinstance(dataset, DataFrame):
            raise Exception('Dataset argument is not a pandas DataFrame')
        if len(dataset.columns.names) != 1:
            raise Exception('Dataset argument need to have only one level column names')
        precalculate = self.precalculate if precalculate is None else bool(precalculate)
        target = str(target)
        if target not in dataset.columns:
            raise Exception('Target is not a column from dataset')
        if (not isinstance(label, str)) or (len(label) == 0):
            raise Exception('Label need to be at least one letter')
        if label in self.list_params('dataset'):
            raise Exception('Labels need to be unique')
        param = DatasetParam(dataset=dataset, label=label, target=target)
        with self.mutex:
            self.update_timestamp()
            self.datasets.append(param)
            self.variables_cache = []
        if precalculate:
            self.plots_manager.fill_cache({'dataset': param})

    def get_params(self, param_type):
        """Returns list of available params

        Parameters
        -----------
        param_type : str
            One of ['model', 'variable', 'observation', 'dataset']. Params of this type
            will be returned

        Notes
        --------
        Information about params https://arena.drwhy.ai/docs/guide/params

        Returns
        --------
        List of Param objects
        """
        if param_type == 'observation':
            with self.mutex:
                return self.observations
        elif param_type == 'variable':
            with self.mutex:
                if not self.variables_cache:
                    # Extract column names from every dataset in self.dataset list and flatten it
                    result_datasets = [col for dataset in self.datasets for col in dataset.variables]
                    # Extract column names from every model in self.models list and flatten it
                    result_explainers = [col for model in self.models for col in model.variables]
                    result_str = np.unique(result_datasets + result_explainers).tolist()
                    self.variables_cache = [VariableParam(x) for x in result_str]
                    if self.enable_attributes:
                        for var in self.variables_cache:
                            try:
                                for dataset in self.datasets:
                                    if var.variable in dataset.variables:
                                        var.update_attributes(dataset.dataset[var.variable])
                                for model in self.models:
                                    if var.variable in model.variables:
                                        var.update_attributes(model.explainer.data[var.variable])
                            except:
                                var.clear_attributes()
                return self.variables_cache
        elif param_type == 'model':
            with self.mutex:
                return self.models
        elif param_type == 'dataset':
            with self.mutex:
                return self.datasets
        else:
            raise Exception('Invalid param type')

    def list_params(self, param_type):
        """Returns list of available params's labels

        Parameters
        -----------
        param_type : str
            One of ['model', 'variable', 'observation', 'dataset']. Labels of params
            of this type will be returned

        Notes
        --------
        Information about params https://arena.drwhy.ai/docs/guide/params

        Returns
        --------
        List of str
        """
        return [x.get_label() for x in self.get_params(param_type)]

    def get_available_params(self):
        """Returns dict containing available params of all types

        This method collect result of `get_params` method for each param type into
        a dict. Keys are param types and values are lists of Param objects.

        Notes
        --------
        Information about params https://arena.drwhy.ai/docs/guide/params

        Returns
        --------
        dict
        """
        result = {}
        for param_type in ['model', 'observation', 'variable', 'dataset']:
            result[param_type] = self.get_params(param_type)
        return result

    def list_available_params(self):
        """Returns dict containing labels of available params of all types

        This methods collect result of `list_params` for each param type into
        a dict. Keys are param types and values are list of labels.

        Notes
        --------
        Information about params https://arena.drwhy.ai/docs/guide/params

        Returns
        --------
        dict
        """
        result = {}
        for param_type in ['model', 'observation', 'variable', 'dataset']:
            result[param_type] = self.list_params(param_type)
        return result

    def find_param_value(self, param_type, param_label):
        """Searches for Param object with specified label

        Parameters
        -----------
        param_type : str
            One of ['model', 'variable', 'observation', 'dataset'].
        param_label : str
            Label of searched param

        Notes
        --------
        Information about params https://arena.drwhy.ai/docs/guide/params

        Returns
        --------
        Param or None
        """
        if param_label is None or not isinstance(param_label, str):
            return None
        return next((x for x in self.get_params(param_type) if x.get_label() == param_label), None)

    def print_options(self, options_category=None):
        """Prints available options for plots

        Parameters
        -----------
        options_category : str or None
            When not None, then only options for plots or resources with this
            category will be printed.

        Notes
        --------
        List of plots with described options for each one https://arena.drwhy.ai/docs/guide/observation-level
        """

        options = self.options.get(options_category)
        if options is None:
            for category in self.options.keys():
                self.print_options(category)
            return
        if len(options.keys()) == 0:
            return
        print('\n\033[1m' + options_category + '\033[0m')
        print('---------------------------------')
        for option_name in options.keys():
            value = options.get(option_name).get('value')
            print(option_name + ': ' + str(value) + '   #' + options.get(option_name).get('desc'))

    def get_option(self, options_category, option):
        """Returns value of specified option

        Parameters
        -----------
        options_category : str
           Category of option. In most cases category is coresponds to one plot_type.
           Categories are underlined in the output of arena.print_options()
        option : str
            Name of the option

        Notes
        --------
        List of plots with described options for each one https://arena.drwhy.ai/docs/guide/observation-level

        Returns
        --------
        None or value of option
        """
        options = self.options.get(options_category)
        if options is None:
            raise Exception('Invalid options category')
        if option not in options.keys():
            return
        with self.mutex:
            return self.options.get(options_category).get(option).get('value')

    def set_option(self, options_category, option, value):
        """Sets value for the plot option

        Parameters
        -----------
        options_category : str or None
            When None, then value will be set for each plot and resource
            having option with name equal to `option` argument. Otherwise only
            for plots and resources with specified options_category.
            In most cases category is coresponds to one plot_type.
            Categories are underlined in the output of arena.print_options()
        option : str
            Name of the option
        value : *
            Value to be set

        Notes
        --------
        List of plots with described options for each one https://arena.drwhy.ai/docs/guide/observation-level
        """
        if options_category is None:
            for category in self.options.keys():
                self.set_option(category, option, value)
            return
        options = self.options.get(options_category)
        if options is None:
            raise Exception('Invalid options category')
        if option not in options.keys():
            return
        with self.mutex:
            self.options[options_category][option]['value'] = value
            for plot_type in np.unique([x.info.get('plotType') for x in self.plots_manager.plots if x.options_category == options_category]):
                self.plots_manager.clear_cache(plot_type)
            for resource_type in np.unique([x.resource_type for x in self.resource_manager.resources if x.options_category == options_category]):
                self.resource_manager.clear_cache(resource_type)
        if self.precalculate:
            self.plots_manager.fill_cache()

    def get_params_attributes(self, param_type=None):
        """Returns attributes for all params

        When `param_type` is not None, then function returns list of dicts. Each dict represents
        one of available attribute for specified param type. Field `name` is attribute name
        and field `values` is mapped list of available params to list of value of attribute.
        When `param_type` is None, then function returns dict with keys for each param type and
        values are lists described above.

        Parameters
        -----------
        param_type : str or None
            One of ['model', 'variable', 'observation', 'dataset'] or None. Specifies
            attributes of which params should be returned.

        Notes
        --------
        Attribused are used for dynamicly modifying observations https://arena.drwhy.ai/docs/guide/modifying-observations

        Returns
        --------
        dict or list
        """

        if param_type is None:
            obj = {}
            for p in ['model', 'observation', 'variable', 'dataset']:
                obj[p] = self.get_params_attributes(p)
            return obj
        if not self.enable_attributes:
            return []
        attrs = Param.get_param_class(param_type).list_attributes(self)
        array = []
        for attr in attrs:
            array.append({
                'name': attr,
                'values': [param.get_attributes().get(attr) for param in self.get_params(param_type)]
            })
        return array

    def get_param_attributes(self, param_type, param_label):
        """Returns attributes for one param

        Function searches for param with specified type and label and
        returns it's attributes.

        Parameters
        -----------
        param_type : str
            One of ['model', 'variable', 'observation', 'dataset'].
        param_label : str
            Label of param

        Notes
        --------
        Attribused are used for dynamicly modifying observations https://arena.drwhy.ai/docs/guide/modifying-observations

        Returns
        --------
        dict
        """

        if not self.enable_attributes:
            return {}
        param_value = self.find_param_value(param_type=param_type, param_label=param_label)
        if param_value:
            return param_value.get_attributes()
        else:
            return {}

    def save(self, filename="datasource.json"):
        """Generate all plots and saves them to JSON file

        Function generates only not cached plots.

        Parameters
        -----------
        filename : str
            Path or filename to output file

        Notes
        --------
        Read more about data sources https://arena.drwhy.ai/docs/guide/basic-concepts

        Returns
        --------
        None
        """
        with open(filename, 'w') as file:
            file.write(get_json(self))

    def upload(self, token=None, arena_url='https://arena.drwhy.ai/', open_browser=True):
        """Generate all plots and uploads them to GitHub Gist

        Function generates only not cached plots. If token is not provided
        then function uses OAuth to open GitHub authorization page.

        Parameters
        -----------
        token : str or None
            GitHub personal access token. If token is None, then OAuth is used.
        arena_url : str
            Address of Arena dashboard instance
        open_browser : bool
            Whether to open Arena after upload.

        Notes
        --------
        Read more about data sources https://arena.drwhy.ai/docs/guide/basic-concepts

        Returns
        --------
        Link to the Arena
        """
        global_check_import('requests')
        if token is None:
            global_check_import('flask')
            global_check_import('flask_cors')
            token = generate_token()
        data_url = upload_arena(self, token)
        url = arena_url + '?data=' + data_url
        if open_browser:
            webbrowser.open(url)
        return url
Methods
def find_param_value(self, param_type, param_label)-
Searches for Param object with specified label
Parameters
param_type:str- One of ['model', 'variable', 'observation', 'dataset'].
param_label:str- Label of searched param
Notes
Information about params https://arena.drwhy.ai/docs/guide/params
Returns
ParamorNone
Expand source code Browse git
def find_param_value(self, param_type, param_label):
    """Searches for Param object with specified label

    Parameters
    -----------
    param_type : str
        One of ['model', 'variable', 'observation', 'dataset'].
    param_label : str
        Label of searched param

    Notes
    --------
    Information about params https://arena.drwhy.ai/docs/guide/params

    Returns
    --------
    Param or None
    """
    if param_label is None or not isinstance(param_label, str):
        return None
    return next((x for x in self.get_params(param_type) if x.get_label() == param_label), None)
def get_available_params(self)-
Returns dict containing available params of all types
This method collect result of
get_paramsmethod for each param type into a dict. Keys are param types and values are lists of Param objects.Notes
Information about params https://arena.drwhy.ai/docs/guide/params
Returns
dict
Expand source code Browse git
def get_available_params(self):
    """Returns dict containing available params of all types

    This method collect result of `get_params` method for each param type into
    a dict. Keys are param types and values are lists of Param objects.

    Notes
    --------
    Information about params https://arena.drwhy.ai/docs/guide/params

    Returns
    --------
    dict
    """
    result = {}
    for param_type in ['model', 'observation', 'variable', 'dataset']:
        result[param_type] = self.get_params(param_type)
    return result
def get_option(self, options_category, option)-
Returns value of specified option
Parameters
options_category:str- Category of option. In most cases category is coresponds to one plot_type.
- Categories are underlined in the output of arena.print_options()
option:str- Name of the option
Notes
List of plots with described options for each one https://arena.drwhy.ai/docs/guide/observation-level
Returns
Noneorvalueofoption
Expand source code Browse git
def get_option(self, options_category, option):
    """Returns value of specified option

    Parameters
    -----------
    options_category : str
       Category of option. In most cases category is coresponds to one plot_type.
       Categories are underlined in the output of arena.print_options()
    option : str
        Name of the option

    Notes
    --------
    List of plots with described options for each one https://arena.drwhy.ai/docs/guide/observation-level

    Returns
    --------
    None or value of option
    """
    options = self.options.get(options_category)
    if options is None:
        raise Exception('Invalid options category')
    if option not in options.keys():
        return
    with self.mutex:
        return self.options.get(options_category).get(option).get('value')
def get_param_attributes(self, param_type, param_label)-
Returns attributes for one param
Function searches for param with specified type and label and returns it's attributes.
Parameters
param_type:str- One of ['model', 'variable', 'observation', 'dataset'].
param_label:str- Label of param
Notes
Attribused are used for dynamicly modifying observations https://arena.drwhy.ai/docs/guide/modifying-observations
Returns
dict
Expand source code Browse git
def get_param_attributes(self, param_type, param_label):
    """Returns attributes for one param

    Function searches for param with specified type and label and
    returns it's attributes.

    Parameters
    -----------
    param_type : str
        One of ['model', 'variable', 'observation', 'dataset'].
    param_label : str
        Label of param

    Notes
    --------
    Attribused are used for dynamicly modifying observations https://arena.drwhy.ai/docs/guide/modifying-observations

    Returns
    --------
    dict
    """

    if not self.enable_attributes:
        return {}
    param_value = self.find_param_value(param_type=param_type, param_label=param_label)
    if param_value:
        return param_value.get_attributes()
    else:
        return {}
def get_params(self, param_type)-
Returns list of available params
Parameters
param_type:str- One of ['model', 'variable', 'observation', 'dataset']. Params of this type will be returned
Notes
Information about params https://arena.drwhy.ai/docs/guide/params
Returns
ListofParam objects
Expand source code Browse git
def get_params(self, param_type):
    """Returns list of available params

    Parameters
    -----------
    param_type : str
        One of ['model', 'variable', 'observation', 'dataset']. Params of this type
        will be returned

    Notes
    --------
    Information about params https://arena.drwhy.ai/docs/guide/params

    Returns
    --------
    List of Param objects
    """
    if param_type == 'observation':
        with self.mutex:
            return self.observations
    elif param_type == 'variable':
        with self.mutex:
            if not self.variables_cache:
                # Extract column names from every dataset in self.dataset list and flatten it
                result_datasets = [col for dataset in self.datasets for col in dataset.variables]
                # Extract column names from every model in self.models list and flatten it
                result_explainers = [col for model in self.models for col in model.variables]
                result_str = np.unique(result_datasets + result_explainers).tolist()
                self.variables_cache = [VariableParam(x) for x in result_str]
                if self.enable_attributes:
                    for var in self.variables_cache:
                        try:
                            for dataset in self.datasets:
                                if var.variable in dataset.variables:
                                    var.update_attributes(dataset.dataset[var.variable])
                            for model in self.models:
                                if var.variable in model.variables:
                                    var.update_attributes(model.explainer.data[var.variable])
                        except:
                            var.clear_attributes()
            return self.variables_cache
    elif param_type == 'model':
        with self.mutex:
            return self.models
    elif param_type == 'dataset':
        with self.mutex:
            return self.datasets
    else:
        raise Exception('Invalid param type')
def get_params_attributes(self, param_type=None)-
Returns attributes for all params
When
param_typeis not None, then function returns list of dicts. Each dict represents one of available attribute for specified param type. Fieldnameis attribute name and fieldvaluesis mapped list of available params to list of value of attribute. Whenparam_typeis None, then function returns dict with keys for each param type and values are lists described above.Parameters
param_type:strorNone- One of ['model', 'variable', 'observation', 'dataset'] or None. Specifies attributes of which params should be returned.
Notes
Attribused are used for dynamicly modifying observations https://arena.drwhy.ai/docs/guide/modifying-observations
Returns
dictorlist
Expand source code Browse git
def get_params_attributes(self, param_type=None):
    """Returns attributes for all params

    When `param_type` is not None, then function returns list of dicts. Each dict represents
    one of available attribute for specified param type. Field `name` is attribute name
    and field `values` is mapped list of available params to list of value of attribute.
    When `param_type` is None, then function returns dict with keys for each param type and
    values are lists described above.

    Parameters
    -----------
    param_type : str or None
        One of ['model', 'variable', 'observation', 'dataset'] or None. Specifies
        attributes of which params should be returned.

    Notes
    --------
    Attribused are used for dynamicly modifying observations https://arena.drwhy.ai/docs/guide/modifying-observations

    Returns
    --------
    dict or list
    """

    if param_type is None:
        obj = {}
        for p in ['model', 'observation', 'variable', 'dataset']:
            obj[p] = self.get_params_attributes(p)
        return obj
    if not self.enable_attributes:
        return []
    attrs = Param.get_param_class(param_type).list_attributes(self)
    array = []
    for attr in attrs:
        array.append({
            'name': attr,
            'values': [param.get_attributes().get(attr) for param in self.get_params(param_type)]
        })
    return array
def get_supported_plots(self)-
Returns plots classes that can produce at least one valid chart for this Arena.
Returns
Listofclasses extending PlotContainer
Expand source code Browse git
def get_supported_plots(self):
    """Returns plots classes that can produce at least one valid chart for this Arena.

    Returns
    -----------
    List of classes extending PlotContainer
    """
    return self.plots_manager.get_supported_plots()
def list_available_params(self)-
Returns dict containing labels of available params of all types
This methods collect result of
list_paramsfor each param type into a dict. Keys are param types and values are list of labels.Notes
Information about params https://arena.drwhy.ai/docs/guide/params
Returns
dict
Expand source code Browse git
def list_available_params(self):
    """Returns dict containing labels of available params of all types

    This methods collect result of `list_params` for each param type into
    a dict. Keys are param types and values are list of labels.

    Notes
    --------
    Information about params https://arena.drwhy.ai/docs/guide/params

    Returns
    --------
    dict
    """
    result = {}
    for param_type in ['model', 'observation', 'variable', 'dataset']:
        result[param_type] = self.list_params(param_type)
    return result
def list_params(self, param_type)-
Returns list of available params's labels
Parameters
param_type:str- One of ['model', 'variable', 'observation', 'dataset']. Labels of params of this type will be returned
Notes
Information about params https://arena.drwhy.ai/docs/guide/params
Returns
Listofstr
Expand source code Browse git
def list_params(self, param_type):
    """Returns list of available params's labels

    Parameters
    -----------
    param_type : str
        One of ['model', 'variable', 'observation', 'dataset']. Labels of params
        of this type will be returned

    Notes
    --------
    Information about params https://arena.drwhy.ai/docs/guide/params

    Returns
    --------
    List of str
    """
    return [x.get_label() for x in self.get_params(param_type)]
def print_options(self, options_category=None)-
Prints available options for plots
Parameters
options_category:strorNone- When not None, then only options for plots or resources with this category will be printed.
Notes
List of plots with described options for each one https://arena.drwhy.ai/docs/guide/observation-level
Expand source code Browse git
def print_options(self, options_category=None):
    """Prints available options for plots

    Parameters
    -----------
    options_category : str or None
        When not None, then only options for plots or resources with this
        category will be printed.

    Notes
    --------
    List of plots with described options for each one https://arena.drwhy.ai/docs/guide/observation-level
    """

    options = self.options.get(options_category)
    if options is None:
        for category in self.options.keys():
            self.print_options(category)
        return
    if len(options.keys()) == 0:
        return
    print('\n\033[1m' + options_category + '\033[0m')
    print('---------------------------------')
    for option_name in options.keys():
        value = options.get(option_name).get('value')
        print(option_name + ': ' + str(value) + '   #' + options.get(option_name).get('desc'))
def push_dataset(self, dataset, target, label, precalculate=None)-
Adds dataset to Arena
Pushed dataset will visualised using exploratory data analysis plots. Function creates DatasetParam object with specified label and target name. When precalculation is enabled triggers filling cache.
Parameters
dataset:pandas.DataFrame- Data frame to be visualised using EDA plots. This dataset should contain target variable.
target:str- Name of target column
label:str- Label for this dataset
precalculate:boolorNone- Overrides constructor
precalculateparameter when it is not None. If true, then only plots using this model will be precalculated.
Expand source code Browse git
def push_dataset(self, dataset, target, label, precalculate=None):
    """Adds dataset to Arena

    Pushed dataset will visualised using exploratory data analysis plots.
    Function creates DatasetParam object with specified label and target name.
    When precalculation is enabled triggers filling cache.

    Parameters
    -----------
    dataset : pandas.DataFrame
        Data frame to be visualised using EDA plots. This
        dataset should contain target variable.
    target : str
        Name of target column
    label : str
        Label for this dataset
    precalculate : bool or None
        Overrides constructor `precalculate` parameter when it is not None.
        If true, then only plots using this model will be precalculated.
    """
    if not isinstance(dataset, DataFrame):
        raise Exception('Dataset argument is not a pandas DataFrame')
    if len(dataset.columns.names) != 1:
        raise Exception('Dataset argument need to have only one level column names')
    precalculate = self.precalculate if precalculate is None else bool(precalculate)
    target = str(target)
    if target not in dataset.columns:
        raise Exception('Target is not a column from dataset')
    if (not isinstance(label, str)) or (len(label) == 0):
        raise Exception('Label need to be at least one letter')
    if label in self.list_params('dataset'):
        raise Exception('Labels need to be unique')
    param = DatasetParam(dataset=dataset, label=label, target=target)
    with self.mutex:
        self.update_timestamp()
        self.datasets.append(param)
        self.variables_cache = []
    if precalculate:
        self.plots_manager.fill_cache({'dataset': param})
def push_model(self, explainer, precalculate=None)-
Adds model to Arena
This method encapsulate explainer in ModelParam object and save appends models fields. When precalculation is enabled triggers filling cache.
Parameters
explainer:Explainer- Explainer created using dalex package
precalculate:boolorNone- Overrides constructor
precalculateparameter when it is not None. If true, then only plots using this model will be precalculated.
Expand source code Browse git
def push_model(self, explainer, precalculate=None):
    """Adds model to Arena

    This method encapsulate explainer in ModelParam object and
    save appends models fields. When precalculation is enabled
    triggers filling cache.

    Parameters
    -----------
    explainer : dalex.Explainer
        Explainer created using dalex package
    precalculate : bool or None
        Overrides constructor `precalculate` parameter when it is not None.
        If true, then only plots using this model will be precalculated.
    """
    if not isinstance(explainer, Explainer):
        raise Exception('Invalid Explainer argument')
    if explainer.label in self.list_params('model'):
        raise Exception('Explainer with the same label was already added')
    precalculate = self.precalculate if precalculate is None else bool(precalculate)
    param = ModelParam(explainer)
    with self.mutex:
        self.update_timestamp()
        self.models.append(param)
        self.variables_cache = []
    if precalculate:
        self.plots_manager.fill_cache({'model': param})
def push_observations(self, observations, precalculate=None)-
Adds observations to Arena
Pushed observations will be used to local explainations. Function creates ObservationParam object for each row of pushed dataset. Label for each observation is taken from row name. When precalculation is enabled triggers filling cache.
Parameters
observations:pandas.DataFrame- Data frame of observations to be explained using instance level plots. Label for each observation is taken from row name.
precalculate:boolorNone- Overrides constructor
precalculateparameter when it is not None. If true, then only plots using thease observations will be precalculated.
Expand source code Browse git
def push_observations(self, observations, precalculate=None):
    """Adds observations to Arena

    Pushed observations will be used to local explainations. Function
    creates ObservationParam object for each row of pushed dataset. Label
    for each observation is taken from row name. When precalculation
    is enabled triggers filling cache.

    Parameters
    -----------
    observations : pandas.DataFrame
        Data frame of observations to be explained using instance level plots.
        Label for each observation is taken from row name.
    precalculate : bool or None
        Overrides constructor `precalculate` parameter when it is not None.
        If true, then only plots using thease observations will be precalculated.
    """
    if not isinstance(observations, DataFrame):
        raise Exception('Observations argument is not a pandas DataFrame')
    if len(observations.index.names) != 1:
        raise Exception('Observations argument need to have only one index')
    if not observations.index.is_unique:
        raise Exception('Observations argument need to have unique indexes')
    precalculate = self.precalculate if precalculate is None else bool(precalculate)
    old_observations = self.list_params('observation')
    observations = observations.set_index(observations.index.astype(str))
    params_objects = []
    for x in observations.index:
        if x in old_observations:
            raise Exception('Indexes of observations need to be unique across all observations')
        params_objects.append(ObservationParam(dataset=observations, index=x))
    with self.mutex:
        self.update_timestamp()
        self.observations.extend(params_objects)
    if precalculate:
        for obs in params_objects:
            self.plots_manager.fill_cache({'observation': obs})
def run_server(self, host='127.0.0.1', port=8181, append_data=False, arena_url='https://arena.drwhy.ai/', disable_logs=True)-
Starts server for live mode of Arena
Parameters
host:str- ip or hostname for the server
port:int- port number for the server
append_data:bool- if generated link should append data to already existing Arena window.
arena_url:str- URl of Arena dhasboard
disable_logs:str- if logs should be muted
Notes
Read more about data sources https://arena.drwhy.ai/docs/guide/basic-concepts
Returns
Link to Arena
Expand source code Browse git
def run_server(self,
               host='127.0.0.1',
               port=8181,
               append_data=False,
               arena_url='https://arena.drwhy.ai/',
               disable_logs=True):
    """Starts server for live mode of Arena

    Parameters
    -----------
    host : str
        ip or hostname for the server
    port : int
        port number for the server
    append_data : bool
        if generated link should append data to already existing Arena window.
    arena_url : str
        URl of Arena dhasboard
    disable_logs : str
        if logs should be muted

    Notes
    --------
    Read more about data sources https://arena.drwhy.ai/docs/guide/basic-concepts

    Returns
    -----------
    Link to Arena
    """
    if self.server_thread:
        raise Exception('Server is already running. To stop ip use arena.stop_server().')
    global_check_import('flask')
    global_check_import('flask_cors')
    global_check_import('requests')
    self.server_thread = threading.Thread(target=start_server, args=(self, host, port, disable_logs))
    self.server_thread.start()
    if append_data:
        print(arena_url + '?append=http://' + host + ':' + str(port) + '/')
    else:
        print(arena_url + '?data=http://' + host + ':' + str(port) + '/')
def save(self, filename='datasource.json')-
Generate all plots and saves them to JSON file
Function generates only not cached plots.
Parameters
filename:str- Path or filename to output file
Notes
Read more about data sources https://arena.drwhy.ai/docs/guide/basic-concepts
Returns
None
Expand source code Browse git
def save(self, filename="datasource.json"):
    """Generate all plots and saves them to JSON file

    Function generates only not cached plots.

    Parameters
    -----------
    filename : str
        Path or filename to output file

    Notes
    --------
    Read more about data sources https://arena.drwhy.ai/docs/guide/basic-concepts

    Returns
    --------
    None
    """
    with open(filename, 'w') as file:
        file.write(get_json(self))
def set_option(self, options_category, option, value)-
Sets value for the plot option
Parameters
options_category:strorNone- When None, then value will be set for each plot and resource
having option with name equal to
optionargument. Otherwise only for plots and resources with specified options_category. In most cases category is coresponds to one plot_type. Categories are underlined in the output of arena.print_options() option:str- Name of the option
value:*- Value to be set
Notes
List of plots with described options for each one https://arena.drwhy.ai/docs/guide/observation-level
Expand source code Browse git
def set_option(self, options_category, option, value):
    """Sets value for the plot option

    Parameters
    -----------
    options_category : str or None
        When None, then value will be set for each plot and resource
        having option with name equal to `option` argument. Otherwise only
        for plots and resources with specified options_category.
        In most cases category is coresponds to one plot_type.
        Categories are underlined in the output of arena.print_options()
    option : str
        Name of the option
    value : *
        Value to be set

    Notes
    --------
    List of plots with described options for each one https://arena.drwhy.ai/docs/guide/observation-level
    """
    if options_category is None:
        for category in self.options.keys():
            self.set_option(category, option, value)
        return
    options = self.options.get(options_category)
    if options is None:
        raise Exception('Invalid options category')
    if option not in options.keys():
        return
    with self.mutex:
        self.options[options_category][option]['value'] = value
        for plot_type in np.unique([x.info.get('plotType') for x in self.plots_manager.plots if x.options_category == options_category]):
            self.plots_manager.clear_cache(plot_type)
        for resource_type in np.unique([x.resource_type for x in self.resource_manager.resources if x.options_category == options_category]):
            self.resource_manager.clear_cache(resource_type)
    if self.precalculate:
        self.plots_manager.fill_cache()
def stop_server(self)-
Stops running server
Expand source code Browse git
def stop_server(self):
    """Stops running server"""
    if not self.server_thread:
        raise Exception('Server is not running')
    self._stop_server()
    self.server_thread.join()
    self.server_thread = None
def update_timestamp(self)-
Updates timestamp
Notes
This function must be called from mutex context
Expand source code Browse git
def update_timestamp(self):
    """Updates timestamp

    Notes
    -------
    This function must be called from mutex context
    """
    now = datetime.now()
    self.timestamp = datetime.timestamp(now)
def upload(self, token=None, arena_url='https://arena.drwhy.ai/', open_browser=True)-
Generate all plots and uploads them to GitHub Gist
Function generates only not cached plots. If token is not provided then function uses OAuth to open GitHub authorization page.
Parameters
token:strorNone- GitHub personal access token. If token is None, then OAuth is used.
arena_url:str- Address of Arena dashboard instance
open_browser:bool- Whether to open Arena after upload.
Notes
Read more about data sources https://arena.drwhy.ai/docs/guide/basic-concepts
Returns
Link to the Arena
Expand source code Browse git
def upload(self, token=None, arena_url='https://arena.drwhy.ai/', open_browser=True):
    """Generate all plots and uploads them to GitHub Gist

    Function generates only not cached plots. If token is not provided
    then function uses OAuth to open GitHub authorization page.

    Parameters
    -----------
    token : str or None
        GitHub personal access token. If token is None, then OAuth is used.
    arena_url : str
        Address of Arena dashboard instance
    open_browser : bool
        Whether to open Arena after upload.

    Notes
    --------
    Read more about data sources https://arena.drwhy.ai/docs/guide/basic-concepts

    Returns
    --------
    Link to the Arena
    """
    global_check_import('requests')
    if token is None:
        global_check_import('flask')
        global_check_import('flask_cors')
        token = generate_token()
    data_url = upload_arena(self, token)
    url = arena_url + '?data=' + data_url
    if open_browser:
        webbrowser.open(url)
    return url
class Aspect (explainer, depend_method='assoc', clust_method='complete', corr_method='spearman', agg_method='max')-
Create Aspect
Explanation methods that do not take into account dependencies between variables can produce misleading results. This class creates a representation of a model based on an Explainer object. In addition, it calculates the relationships between the variables that can be used to create explanations. Methods of this class produce explanation objects, that contain the main result attribute, and can be visualised using the plot method.
The
explaineris the only required parameter.Parameters
explainer:Explainer object- Model wrapper created using the Explainer class.
depend_method:{'assoc', 'pps'}orfunction, optional- The method of calculating the dependencies between variables (i.e. the dependency
matrix). Default is
'assoc', which means the use of statistical association (correlation coefficient, Cramér's V based on Pearson's chi-squared statistic and eta-quared based on Kruskal-Wallis H-statistic);'pps'stands for Power Predictive Score. NOTE: When a function is passed, it is called with theexplainer.dataand it must return a symmetric dependency matrix (pd.DataFramewith variable names as columns and rows). clust_method:{'complete', 'single', 'average', 'weighted', 'centroid', 'median', 'ward'}, optional- The linkage algorithm to use for variables hierarchical clustering
(default is
'complete'). corr_method:{'spearman', 'pearson', 'kendall'}, optional- The method of calculating correlation between numerical variables
(default is
'spearman'). NOTE: Ignored ifdepend_methodis not'assoc'. agg_method:{'max', 'min', 'avg'}, optional- The method of aggregating the PPS values for pairs of variables
(default is
'max'). NOTE: Ignored ifdepend_methodis not'pps'.
Attributes
explainer:Explainer object- Model wrapper created using the Explainer class.
depend_method:{'assoc', 'pps'}orfunction- The method of calculating the dependencies between variables.
clust_method:{'complete', 'single', 'average', 'weighted', 'centroid', 'median', 'ward'}- The linkage algorithm to use for variables hierarchical clustering.
corr_method:{'spearman', 'pearson', 'kendall'}- The method of calculating correlation between numerical variables.
agg_method:{'max', 'min', 'avg'}- The method of aggregating the PPS values for pairs of variables.
depend_matrix:pd.DataFrame- The dependency matrix (with variable names as columns and rows).
linkage_matrix : The hierarchical clustering of variables encoded as a
scipylinkage matrix.Notes
- assoc, eta-squared: http://tss.awf.poznan.pl/files/3_Trends_Vol21_2014__no1_20.pdf
- assoc, Cramér's V: http://stats.lse.ac.uk/bergsma/pdf/cramerV3.pdf
- PPS: https://github.com/8080labs/ppscore
- triplot: https://arxiv.org/abs/2104.03403
Expand source code Browse git
class Aspect:
    """Create Aspect

    Explanation methods that do not take into account dependencies between variables
    can produce misleading results. This class creates a representation of a model based
    on an Explainer object. In addition, it calculates the relationships between
    the variables that can be used to create explanations. Methods of this class produce
    explanation objects, that contain the main result attribute, and can be visualised
    using the plot method.

    The `explainer` is the only required parameter.

    Parameters
    ----------
    explainer : Explainer object
        Model wrapper created using the Explainer class.
    depend_method: {'assoc', 'pps'} or function, optional
        The method of calculating the dependencies between variables (i.e. the dependency
        matrix). Default is `'assoc'`, which means the use of statistical association
        (correlation coefficient, Cramér's V based on Pearson's chi-squared statistic
        and eta-quared based on Kruskal-Wallis H-statistic);
        `'pps'` stands for Power Predictive Score.
        NOTE: When a function is passed, it is called with the `explainer.data` and it
        must return a symmetric dependency matrix (`pd.DataFrame` with variable names as
        columns and rows).
    clust_method : {'complete', 'single', 'average', 'weighted', 'centroid', 'median', 'ward'}, optional
        The linkage algorithm to use for variables hierarchical clustering
        (default is `'complete'`).
    corr_method : {'spearman', 'pearson', 'kendall'}, optional
        The method of calculating correlation between numerical variables
        (default is `'spearman'`).
        NOTE: Ignored if `depend_method` is not `'assoc'`.
    agg_method : {'max', 'min', 'avg'}, optional
        The method of aggregating the PPS values for pairs of variables
        (default is `'max'`).
        NOTE: Ignored if `depend_method` is not `'pps'`.

    Attributes
    --------
    explainer : Explainer object
        Model wrapper created using the Explainer class.
    depend_method : {'assoc', 'pps'} or function
        The method of calculating the dependencies between variables.
    clust_method : {'complete', 'single', 'average', 'weighted', 'centroid', 'median', 'ward'}
        The linkage algorithm to use for variables hierarchical clustering.
    corr_method : {'spearman', 'pearson', 'kendall'}
        The method of calculating correlation between numerical variables.
    agg_method : {'max', 'min', 'avg'}
        The method of aggregating the PPS values for pairs of variables.
    depend_matrix : pd.DataFrame
        The dependency matrix (with variable names as columns and rows).
    linkage_matrix :
        The hierarchical clustering of variables encoded as a `scipy` linkage matrix.

    Notes
    -----
    - assoc, eta-squared: http://tss.awf.poznan.pl/files/3_Trends_Vol21_2014__no1_20.pdf
    - assoc, Cramér's V: http://stats.lse.ac.uk/bergsma/pdf/cramerV3.pdf
    - PPS: https://github.com/8080labs/ppscore
    - triplot: https://arxiv.org/abs/2104.03403
    """

    def __init__(
        self,
        explainer,
        depend_method="assoc",
        clust_method="complete",
        corr_method="spearman",
        agg_method="max",
    ):
        _depend_method, _corr_method, _agg_method = checks.check_method_depend(depend_method, corr_method, agg_method)
        self.explainer = explainer
        self.depend_method = _depend_method
        self.clust_method = clust_method
        self.corr_method = _corr_method
        self.agg_method = _agg_method
        self.depend_matrix = utils.calculate_depend_matrix(
            self.explainer.data, self.depend_method, self.corr_method, self.agg_method
        )
        self.linkage_matrix = utils.calculate_linkage_matrix(
            self.depend_matrix, clust_method
        )
        self._hierarchical_clustering_dendrogram = plot.plot_dendrogram(
            self.linkage_matrix, self.depend_matrix.columns
        )
        self._dendrogram_aspects_ordered = utils.get_dendrogram_aspects_ordered(
            self._hierarchical_clustering_dendrogram, self.depend_matrix
        )
        self._full_hierarchical_aspect_importance = None
        self._mt_params = None

    def get_aspects(self, h=0.5, n=None):
        from scipy.cluster.hierarchy import fcluster
        """Form aspects of variables from the hierarchical clustering

        Parameters
        ----------
        h : float, optional
            Threshold to apply when forming aspects, i.e., the minimum value of the dependency
            between the variables grouped in one aspect (default is `0.5`).
            NOTE: Ignored if `n` is not `None`.
        n : int, optional
            Maximum number of aspects to form
            (default is `None`, which means the use of `h` parameter).

        Returns
        -------
        dict of lists
            Variables grouped in aspects, e.g. `{'aspect_1': ['x1', 'x2'], 'aspect_2': ['y1', 'y2']}`.
        """
        if n is None:
            aspect_label = fcluster(self.linkage_matrix, 1 - h, criterion="distance")
        else:
            aspect_label = fcluster(self.linkage_matrix, n, criterion="maxclust")
        aspects = pd.DataFrame(
            {"feature": self.depend_matrix.columns, "aspect": aspect_label}
        )
        aspects = aspects.groupby("aspect")["feature"].apply(list).reset_index()
        aspects_dict = {}

        # rename an aspect when there is a single variable in it
        i = 1
        for index, row in aspects.iterrows():
            if len(row["feature"]) > 1:
                aspects_dict[f"aspect_{i}"] = row["feature"]
                i += 1
            else:
                aspects_dict[row["feature"][0]] = row["feature"]

        return aspects_dict

    def plot_dendrogram(
        self,
        title="Hierarchical clustering dendrogram",
        lines_interspace=20,
        rounding_function=np.round,
        digits=3,
        show=True,
    ):
        """Plot the hierarchical clustering dendrogram of variables

        Parameters
        ----------
        title : str, optional
            Title of the plot (default is "Hierarchical clustering dendrogram").
        lines_interspace : float, optional
            Interspace between lines of dendrogram in px (default is `20`).
        rounding_function : function, optional
            A function that will be used for rounding numbers (default is `np.around`).
        digits : int, optional
            Number of decimal places (`np.around`) to round contributions.
            See `rounding_function` parameter (default is `3`).
        show : bool, optional
            `True` shows the plot; `False` returns the plotly Figure object that can
            be edited or saved using the `write_image()` method (default is `True`).

        Returns
        -------
        None or plotly.graph_objects.Figure
            Return figure that can be edited or saved. See `show` parameter.
        """
        m = len(self.depend_matrix.columns)
        plot_height = 78 + 71 + m * lines_interspace + (m + 1) * lines_interspace / 4
        fig = self._hierarchical_clustering_dendrogram
        fig = plot.add_text_and_tooltips_to_dendrogram(
            fig, self._dendrogram_aspects_ordered, rounding_function, digits
        )
        fig = plot._add_points_on_dendrogram_traces(fig)
        fig.update_layout(
            title={"text": title, "x": 0.15},
            yaxis={"automargin": True, "autorange": "reversed"},
            height=plot_height,
        )
        if show:
            fig.show(config=_theme.get_default_config())
        else:
            return fig

    def predict_parts(
        self,
        new_observation,
        variable_groups=None,
        type="default",
        h=0.5,
        N=2000,
        B=25,
        n_aspects=None,
        sample_method="default",
        f=2,
        label=None,
        processes=1,
        random_state=None,
    ):
        """Calculate predict-level aspect importance

        Parameters
        ----------
        new_observation : pd.Series or np.ndarray (1d) or pd.DataFrame (1,p)
            An observation for which a prediction needs to be explained.
        variable_groups : dict of lists or None
            Variables grouped in aspects to calculate their importance (default is `None`).
        type : {'default', 'shap'}, optional
            Type of aspect importance/attributions (default is `'default'`, which means
            the use of simplified LIME method).
        h : float, optional
            Threshold to apply when forming aspects, i.e., the minimum value of the dependency
            between the variables grouped in one aspect (default is `0.5`).
        N : int, optional
            Number of observations that will be sampled from the `explainer.data` attribute
            before the calculation of aspect importance (default is `2000`).
        B : int, optional
            Parameter specific for `type == 'shap'`. Number of random paths to calculate aspect
            attributions (default is `25`).
            NOTE: Ignored if `type` is not `'shap'`.
        n_aspects : int, optional
            Parameter specific for `type == 'default'`. Maximum number of non-zero importances, i.e.
            coefficients after lasso fitting (default is `None`, which means the linear regression is used).
            NOTE: Ignored if `type` is not `'default'`.
        sample_method : {'default', 'binom'}, optional
            Parameter specific for `type == 'default'`. Sampling method for creating binary matrix
            used as mask for replacing aspects in sampled data (default is `'default'`, which means
            it randomly replaces one or two zeros per row; `'binom'` replaces random number of zeros
            per row).
            NOTE: Ignored if `type` is not `'default'`.
        f : int, optional
            Parameter specific for `type == 'default'` and `sample_method == 'binom'`. Parameter
            controlling average number of replaced zeros for binomial sampling (default is `2`).
            NOTE: Ignored if `type` is not `'default'` or `sample_method` is not `'binom'`.
        label : str, optional
            Name to appear in result and plots. Overrides default.
        processes : int, optional
            Parameter specific for `type == 'shap'`. Number of parallel processes to use in calculations.
            Iterated over `B` (default is `1`, which means no parallel computation).
        random_state : int, optional
            Set seed for random number generator (default is random seed).

        Returns
        -------
        PredictAspectImportance class object
            Explanation object containing the main result attribute and the plot method.
        """

        if variable_groups is None:
            variable_groups = self.get_aspects(h)

        pai = PredictAspectImportance(
            variable_groups,
            type,
            N,
            B,
            n_aspects,
            sample_method,
            f,
            self.depend_method,
            self.corr_method,
            self.agg_method,
            processes,
            random_state,
            _depend_matrix=self.depend_matrix
        )

        pai.fit(self.explainer, new_observation)

        if label is not None:
            pai.result["label"] = label

        return pai

    def model_parts(
        self,
        variable_groups=None,
        h=0.5,
        loss_function=None,
        type="variable_importance",
        N=1000,
        B=10,
        processes=1,
        label=None,
        random_state=None,
    ):
        """Calculate model-level aspect importance

        Parameters
        ----------
        variable_groups : dict of lists or None
            Variables grouped in aspects to calculate their importance (default is `None`).
        h : float, optional
            Threshold to apply when forming aspects, i.e., the minimum value of the dependency
            between the variables grouped in one aspect (default is `0.5`).
        loss_function :  {'rmse', '1-auc', 'mse', 'mae', 'mad'} or function, optional
            If string, then such loss function will be used to assess aspect importance
            (default is `'rmse'` or `'1-auc'`, depends on `explainer.model_type` attribute).
        type : {'variable_importance', 'ratio', 'difference'}, optional
            Type of transformation that will be applied to dropout loss
            (default is `'variable_importance'`, which is Permutational Variable Importance).
        N : int, optional
            Number of observations that will be sampled from the `explainer.data` attribute before
            the calculation of aspect importance. `None` means all `data` (default is `1000`).
        B : int, optional
            Number of permutation rounds to perform on each variable (default is `10`).
        processes : int, optional
            Number of parallel processes to use in calculations. Iterated over `B`
            (default is `1`, which means no parallel computation).
        label : str, optional
            Name to appear in result and plots. Overrides default.
        random_state : int, optional
            Set seed for random number generator (default is random seed).

        Returns
        -------
        ModelAspectImportance class object
            Explanation object containing the main result attribute and the plot method.
        """

        loss_function = checks.check_method_loss_function(self.explainer, loss_function)
        mai_result = None

        if variable_groups is None:
            variable_groups = self.get_aspects(h)

            # get results from triplot if it was precalculated with the same params
            if self._full_hierarchical_aspect_importance is not None:
                if (
                    self._mt_params["loss_function"] == loss_function
                    and self._mt_params["N"] == N
                    and self._mt_params["B"] == B
                    and self._mt_params["type"] == type
                ):
                    h = min(1, h)
                    h_selected = np.unique(
                        self._full_hierarchical_aspect_importance.loc[
                            self._full_hierarchical_aspect_importance.h >= h
                        ].h
                    )[0]
                    mai_result = self._full_hierarchical_aspect_importance.loc[
                        self._full_hierarchical_aspect_importance.h == h_selected
                    ]

        ai = ModelAspectImportance(
            loss_function=loss_function,
            type=type,
            N=N,
            B=B,
            variable_groups=variable_groups,
            processes=processes,
            random_state=random_state,
            _depend_matrix=self.depend_matrix
        )

        # calculate if there was no results
        if mai_result is None:
            ai.fit(self.explainer)
        else:
            mai_result = mai_result[
                [
                    "aspect_name",
                    "variable_names",
                    "dropout_loss",
                    "dropout_loss_change",
                    "min_depend",
                    "vars_min_depend",
                    "label",
                ]
            ]
            ai.result = mai_result

        if label is not None:
            ai.result["label"] = label

        return ai

    def predict_triplot(
        self,
        new_observation,
        type="default",
        N=2000,
        B=25,
        sample_method="default",
        f=2,
        processes=1,
        random_state=None,
    ):
        """Calculate predict-level hierarchical aspect importance

        Parameters
        ----------
        new_observation : pd.Series or np.ndarray (1d) or pd.DataFrame (1,p)
            An observation for which a prediction needs to be explained.
        type : {'default', 'shap'}, optional
            Type of aspect importance/attributions (default is `'default'`, which means
            the use of simplified LIME method).
        N : int, optional
            Number of observations that will be sampled from the `explainer.data` attribute
            before the calculation of aspect importance (default is `2000`).
        B : int, optional
            Parameter specific for `type == 'shap'`. Number of random paths to calculate aspect
            attributions (default is `25`).
            NOTE: Ignored if `type` is not `'shap'`.
        sample_method : {'default', 'binom'}, optional
            Parameter specific for `type == 'default'`. Sampling method for creating binary matrix
            used as mask for replacing aspects in data (default is `'default'`, which means
            it randomly replaces one or two zeros per row; `'binom'` replaces random number of zeros
            per row).
            NOTE: Ignored if `type` is not `'default'`.
        f : int, optional
            Parameter specific for `type == 'default'` and `sample_method == 'binom'`. Parameter
            controlling average number of replaced zeros for binomial sampling (default is `2`).
            NOTE: Ignored if `type` is not `'default'` or `sample_method` is not `'binom'`.
        processes : int, optional
            Number of parallel processes to use in calculations. Iterated over `B`
            (default is `1`, which means no parallel computation).
        random_state : int, optional
            Set seed for random number generator (default is random seed).

        Returns
        -------
        PredictTriplot class object
            Explanation object containing the main result attribute and the plot method.
        """

        pt = PredictTriplot(type, N, B, sample_method, f, processes, random_state)

        pt.fit(self, new_observation)

        return pt

    def model_triplot(
        self,
        loss_function=None,
        type="variable_importance",
        N=1000,
        B=10,
        processes=1,
        random_state=None,
    ):
        """Calculate model-level hierarchical aspect importance

        Parameters
        ----------
        loss_function :  {'rmse', '1-auc', 'mse', 'mae', 'mad'} or function, optional
            If string, then such loss function will be used to assess aspect importance
            (default is `'rmse'` or `'1-auc'`, depends on `explainer.model_type` attribute).
        type : {'variable_importance', 'ratio', 'difference'}, optional
            Type of transformation that will be applied to dropout loss
            (default is `'variable_importance'`, which is Permutational Variable Importance).
        N : int, optional
            Number of observations that will be sampled from the `explainer.data` attribute before
            the calculation of aspect importance. `None` means all `data` (default is `1000`).
        B : int, optional
            Number of permutation rounds to perform on each variable (default is `10`).
        processes : int, optional
            Number of parallel processes to use in calculations. Iterated over `B`
            (default is `1`, which means no parallel computation).
        random_state : int, optional
            Set seed for random number generator (default is random seed).

        Returns
        -------
        ModelTriplot class object
            Explanation object containing the main result attribute and the plot method.
        """


        loss_function = checks.check_method_loss_function(self.explainer, loss_function) # get proper loss_function for model_type
        mt = ModelTriplot(loss_function, type, N, B, processes, random_state)
        self._mt_params = {"loss_function": loss_function, "type": type, "N": N, "B": B} # save params for future calls of model_parts
        mt.fit(self)

        return mt
Methods
def get_aspects(self, h=0.5, n=None)-
Expand source code Browse git
def get_aspects(self, h=0.5, n=None):
    from scipy.cluster.hierarchy import fcluster
    """Form aspects of variables from the hierarchical clustering

    Parameters
    ----------
    h : float, optional
        Threshold to apply when forming aspects, i.e., the minimum value of the dependency
        between the variables grouped in one aspect (default is `0.5`).
        NOTE: Ignored if `n` is not `None`.
    n : int, optional
        Maximum number of aspects to form
        (default is `None`, which means the use of `h` parameter).

    Returns
    -------
    dict of lists
        Variables grouped in aspects, e.g. `{'aspect_1': ['x1', 'x2'], 'aspect_2': ['y1', 'y2']}`.
    """
    if n is None:
        aspect_label = fcluster(self.linkage_matrix, 1 - h, criterion="distance")
    else:
        aspect_label = fcluster(self.linkage_matrix, n, criterion="maxclust")
    aspects = pd.DataFrame(
        {"feature": self.depend_matrix.columns, "aspect": aspect_label}
    )
    aspects = aspects.groupby("aspect")["feature"].apply(list).reset_index()
    aspects_dict = {}

    # rename an aspect when there is a single variable in it
    i = 1
    for index, row in aspects.iterrows():
        if len(row["feature"]) > 1:
            aspects_dict[f"aspect_{i}"] = row["feature"]
            i += 1
        else:
            aspects_dict[row["feature"][0]] = row["feature"]

    return aspects_dict
def model_parts(self, variable_groups=None, h=0.5, loss_function=None, type='variable_importance', N=1000, B=10, processes=1, label=None, random_state=None)-
Calculate model-level aspect importance
Parameters
variable_groups:dictoflistsorNone- Variables grouped in aspects to calculate their importance (default is
None). h:float, optional- Threshold to apply when forming aspects, i.e., the minimum value of the dependency
between the variables grouped in one aspect (default is
0.5). loss_function:{'rmse', '1-auc', 'mse', 'mae', 'mad'}orfunction, optional- If string, then such loss function will be used to assess aspect importance
(default is
'rmse'or'1-auc', depends onexplainer.model_typeattribute). type:{'variable_importance', 'ratio', 'difference'}, optional- Type of transformation that will be applied to dropout loss
(default is
'variable_importance', which is Permutational Variable Importance). N:int, optional- Number of observations that will be sampled from the
explainer.dataattribute before the calculation of aspect importance.Nonemeans alldata(default is1000). B:int, optional- Number of permutation rounds to perform on each variable (default is
10). processes:int, optional- Number of parallel processes to use in calculations. Iterated over
B(default is1, which means no parallel computation). label:str, optional- Name to appear in result and plots. Overrides default.
random_state:int, optional- Set seed for random number generator (default is random seed).
Returns
ModelAspectImportance class object- Explanation object containing the main result attribute and the plot method.
Expand source code Browse git
def model_parts(
    self,
    variable_groups=None,
    h=0.5,
    loss_function=None,
    type="variable_importance",
    N=1000,
    B=10,
    processes=1,
    label=None,
    random_state=None,
):
    """Calculate model-level aspect importance

    Parameters
    ----------
    variable_groups : dict of lists or None
        Variables grouped in aspects to calculate their importance (default is `None`).
    h : float, optional
        Threshold to apply when forming aspects, i.e., the minimum value of the dependency
        between the variables grouped in one aspect (default is `0.5`).
    loss_function :  {'rmse', '1-auc', 'mse', 'mae', 'mad'} or function, optional
        If string, then such loss function will be used to assess aspect importance
        (default is `'rmse'` or `'1-auc'`, depends on `explainer.model_type` attribute).
    type : {'variable_importance', 'ratio', 'difference'}, optional
        Type of transformation that will be applied to dropout loss
        (default is `'variable_importance'`, which is Permutational Variable Importance).
    N : int, optional
        Number of observations that will be sampled from the `explainer.data` attribute before
        the calculation of aspect importance. `None` means all `data` (default is `1000`).
    B : int, optional
        Number of permutation rounds to perform on each variable (default is `10`).
    processes : int, optional
        Number of parallel processes to use in calculations. Iterated over `B`
        (default is `1`, which means no parallel computation).
    label : str, optional
        Name to appear in result and plots. Overrides default.
    random_state : int, optional
        Set seed for random number generator (default is random seed).

    Returns
    -------
    ModelAspectImportance class object
        Explanation object containing the main result attribute and the plot method.
    """

    loss_function = checks.check_method_loss_function(self.explainer, loss_function)
    mai_result = None

    if variable_groups is None:
        variable_groups = self.get_aspects(h)

        # get results from triplot if it was precalculated with the same params
        if self._full_hierarchical_aspect_importance is not None:
            if (
                self._mt_params["loss_function"] == loss_function
                and self._mt_params["N"] == N
                and self._mt_params["B"] == B
                and self._mt_params["type"] == type
            ):
                h = min(1, h)
                h_selected = np.unique(
                    self._full_hierarchical_aspect_importance.loc[
                        self._full_hierarchical_aspect_importance.h >= h
                    ].h
                )[0]
                mai_result = self._full_hierarchical_aspect_importance.loc[
                    self._full_hierarchical_aspect_importance.h == h_selected
                ]

    ai = ModelAspectImportance(
        loss_function=loss_function,
        type=type,
        N=N,
        B=B,
        variable_groups=variable_groups,
        processes=processes,
        random_state=random_state,
        _depend_matrix=self.depend_matrix
    )

    # calculate if there was no results
    if mai_result is None:
        ai.fit(self.explainer)
    else:
        mai_result = mai_result[
            [
                "aspect_name",
                "variable_names",
                "dropout_loss",
                "dropout_loss_change",
                "min_depend",
                "vars_min_depend",
                "label",
            ]
        ]
        ai.result = mai_result

    if label is not None:
        ai.result["label"] = label

    return ai
def model_triplot(self, loss_function=None, type='variable_importance', N=1000, B=10, processes=1, random_state=None)-
Calculate model-level hierarchical aspect importance
Parameters
loss_function:{'rmse', '1-auc', 'mse', 'mae', 'mad'}orfunction, optional- If string, then such loss function will be used to assess aspect importance
(default is
'rmse'or'1-auc', depends onexplainer.model_typeattribute). type:{'variable_importance', 'ratio', 'difference'}, optional- Type of transformation that will be applied to dropout loss
(default is
'variable_importance', which is Permutational Variable Importance). N:int, optional- Number of observations that will be sampled from the
explainer.dataattribute before the calculation of aspect importance.Nonemeans alldata(default is1000). B:int, optional- Number of permutation rounds to perform on each variable (default is
10). processes:int, optional- Number of parallel processes to use in calculations. Iterated over
B(default is1, which means no parallel computation). random_state:int, optional- Set seed for random number generator (default is random seed).
Returns
ModelTriplot class object- Explanation object containing the main result attribute and the plot method.
Expand source code Browse git
def model_triplot(
    self,
    loss_function=None,
    type="variable_importance",
    N=1000,
    B=10,
    processes=1,
    random_state=None,
):
    """Calculate model-level hierarchical aspect importance

    Parameters
    ----------
    loss_function :  {'rmse', '1-auc', 'mse', 'mae', 'mad'} or function, optional
        If string, then such loss function will be used to assess aspect importance
        (default is `'rmse'` or `'1-auc'`, depends on `explainer.model_type` attribute).
    type : {'variable_importance', 'ratio', 'difference'}, optional
        Type of transformation that will be applied to dropout loss
        (default is `'variable_importance'`, which is Permutational Variable Importance).
    N : int, optional
        Number of observations that will be sampled from the `explainer.data` attribute before
        the calculation of aspect importance. `None` means all `data` (default is `1000`).
    B : int, optional
        Number of permutation rounds to perform on each variable (default is `10`).
    processes : int, optional
        Number of parallel processes to use in calculations. Iterated over `B`
        (default is `1`, which means no parallel computation).
    random_state : int, optional
        Set seed for random number generator (default is random seed).

    Returns
    -------
    ModelTriplot class object
        Explanation object containing the main result attribute and the plot method.
    """


    loss_function = checks.check_method_loss_function(self.explainer, loss_function) # get proper loss_function for model_type
    mt = ModelTriplot(loss_function, type, N, B, processes, random_state)
    self._mt_params = {"loss_function": loss_function, "type": type, "N": N, "B": B} # save params for future calls of model_parts
    mt.fit(self)

    return mt
def plot_dendrogram(self, title='Hierarchical clustering dendrogram', lines_interspace=20, rounding_function=<function round_>, digits=3, show=True)-
Plot the hierarchical clustering dendrogram of variables
Parameters
title:str, optional- Title of the plot (default is "Hierarchical clustering dendrogram").
lines_interspace:float, optional- Interspace between lines of dendrogram in px (default is
20). rounding_function:function, optional- A function that will be used for rounding numbers (default is
np.around). digits:int, optional- Number of decimal places (
np.around) to round contributions. Seerounding_functionparameter (default is3). show:bool, optionalTrueshows the plot;Falsereturns the plotly Figure object that can be edited or saved using thewrite_image()method (default isTrue).
Returns
Noneorplotly.graph_objects.Figure- Return figure that can be edited or saved. See
showparameter.
Expand source code Browse git
def plot_dendrogram(
    self,
    title="Hierarchical clustering dendrogram",
    lines_interspace=20,
    rounding_function=np.round,
    digits=3,
    show=True,
):
    """Plot the hierarchical clustering dendrogram of variables

    Parameters
    ----------
    title : str, optional
        Title of the plot (default is "Hierarchical clustering dendrogram").
    lines_interspace : float, optional
        Interspace between lines of dendrogram in px (default is `20`).
    rounding_function : function, optional
        A function that will be used for rounding numbers (default is `np.around`).
    digits : int, optional
        Number of decimal places (`np.around`) to round contributions.
        See `rounding_function` parameter (default is `3`).
    show : bool, optional
        `True` shows the plot; `False` returns the plotly Figure object that can
        be edited or saved using the `write_image()` method (default is `True`).

    Returns
    -------
    None or plotly.graph_objects.Figure
        Return figure that can be edited or saved. See `show` parameter.
    """
    m = len(self.depend_matrix.columns)
    plot_height = 78 + 71 + m * lines_interspace + (m + 1) * lines_interspace / 4
    fig = self._hierarchical_clustering_dendrogram
    fig = plot.add_text_and_tooltips_to_dendrogram(
        fig, self._dendrogram_aspects_ordered, rounding_function, digits
    )
    fig = plot._add_points_on_dendrogram_traces(fig)
    fig.update_layout(
        title={"text": title, "x": 0.15},
        yaxis={"automargin": True, "autorange": "reversed"},
        height=plot_height,
    )
    if show:
        fig.show(config=_theme.get_default_config())
    else:
        return fig
def predict_parts(self, new_observation, variable_groups=None, type='default', h=0.5, N=2000, B=25, n_aspects=None, sample_method='default', f=2, label=None, processes=1, random_state=None)-
Calculate predict-level aspect importance
Parameters
new_observation:pd.Seriesornp.ndarray (1d)orpd.DataFrame (1,p)- An observation for which a prediction needs to be explained.
variable_groups:dictoflistsorNone- Variables grouped in aspects to calculate their importance (default is
None). type:{'default', 'shap'}, optional- Type of aspect importance/attributions (default is
'default', which means the use of simplified LIME method). h:float, optional- Threshold to apply when forming aspects, i.e., the minimum value of the dependency
between the variables grouped in one aspect (default is
0.5). N:int, optional- Number of observations that will be sampled from the
explainer.dataattribute before the calculation of aspect importance (default is2000). B:int, optional- Parameter specific for
type == 'shap'. Number of random paths to calculate aspect attributions (default is25). NOTE: Ignored iftypeis not'shap'. n_aspects:int, optional- Parameter specific for
type == 'default'. Maximum number of non-zero importances, i.e. coefficients after lasso fitting (default isNone, which means the linear regression is used). NOTE: Ignored iftypeis not'default'. sample_method:{'default', 'binom'}, optional- Parameter specific for
type == 'default'. Sampling method for creating binary matrix used as mask for replacing aspects in sampled data (default is'default', which means it randomly replaces one or two zeros per row;'binom'replaces random number of zeros per row). NOTE: Ignored iftypeis not'default'. f:int, optional- Parameter specific for
type == 'default'andsample_method == 'binom'. Parameter controlling average number of replaced zeros for binomial sampling (default is2). NOTE: Ignored iftypeis not'default'orsample_methodis not'binom'. label:str, optional- Name to appear in result and plots. Overrides default.
processes:int, optional- Parameter specific for
type == 'shap'. Number of parallel processes to use in calculations. Iterated overB(default is1, which means no parallel computation). random_state:int, optional- Set seed for random number generator (default is random seed).
Returns
PredictAspectImportance class object- Explanation object containing the main result attribute and the plot method.
Expand source code Browse git
def predict_parts(
    self,
    new_observation,
    variable_groups=None,
    type="default",
    h=0.5,
    N=2000,
    B=25,
    n_aspects=None,
    sample_method="default",
    f=2,
    label=None,
    processes=1,
    random_state=None,
):
    """Calculate predict-level aspect importance

    Parameters
    ----------
    new_observation : pd.Series or np.ndarray (1d) or pd.DataFrame (1,p)
        An observation for which a prediction needs to be explained.
    variable_groups : dict of lists or None
        Variables grouped in aspects to calculate their importance (default is `None`).
    type : {'default', 'shap'}, optional
        Type of aspect importance/attributions (default is `'default'`, which means
        the use of simplified LIME method).
    h : float, optional
        Threshold to apply when forming aspects, i.e., the minimum value of the dependency
        between the variables grouped in one aspect (default is `0.5`).
    N : int, optional
        Number of observations that will be sampled from the `explainer.data` attribute
        before the calculation of aspect importance (default is `2000`).
    B : int, optional
        Parameter specific for `type == 'shap'`. Number of random paths to calculate aspect
        attributions (default is `25`).
        NOTE: Ignored if `type` is not `'shap'`.
    n_aspects : int, optional
        Parameter specific for `type == 'default'`. Maximum number of non-zero importances, i.e.
        coefficients after lasso fitting (default is `None`, which means the linear regression is used).
        NOTE: Ignored if `type` is not `'default'`.
    sample_method : {'default', 'binom'}, optional
        Parameter specific for `type == 'default'`. Sampling method for creating binary matrix
        used as mask for replacing aspects in sampled data (default is `'default'`, which means
        it randomly replaces one or two zeros per row; `'binom'` replaces random number of zeros
        per row).
        NOTE: Ignored if `type` is not `'default'`.
    f : int, optional
        Parameter specific for `type == 'default'` and `sample_method == 'binom'`. Parameter
        controlling average number of replaced zeros for binomial sampling (default is `2`).
        NOTE: Ignored if `type` is not `'default'` or `sample_method` is not `'binom'`.
    label : str, optional
        Name to appear in result and plots. Overrides default.
    processes : int, optional
        Parameter specific for `type == 'shap'`. Number of parallel processes to use in calculations.
        Iterated over `B` (default is `1`, which means no parallel computation).
    random_state : int, optional
        Set seed for random number generator (default is random seed).

    Returns
    -------
    PredictAspectImportance class object
        Explanation object containing the main result attribute and the plot method.
    """

    if variable_groups is None:
        variable_groups = self.get_aspects(h)

    pai = PredictAspectImportance(
        variable_groups,
        type,
        N,
        B,
        n_aspects,
        sample_method,
        f,
        self.depend_method,
        self.corr_method,
        self.agg_method,
        processes,
        random_state,
        _depend_matrix=self.depend_matrix
    )

    pai.fit(self.explainer, new_observation)

    if label is not None:
        pai.result["label"] = label

    return pai
def predict_triplot(self, new_observation, type='default', N=2000, B=25, sample_method='default', f=2, processes=1, random_state=None)-
Calculate predict-level hierarchical aspect importance
Parameters
new_observation:pd.Seriesornp.ndarray (1d)orpd.DataFrame (1,p)- An observation for which a prediction needs to be explained.
type:{'default', 'shap'}, optional- Type of aspect importance/attributions (default is
'default', which means the use of simplified LIME method). N:int, optional- Number of observations that will be sampled from the
explainer.dataattribute before the calculation of aspect importance (default is2000). B:int, optional- Parameter specific for
type == 'shap'. Number of random paths to calculate aspect attributions (default is25). NOTE: Ignored iftypeis not'shap'. sample_method:{'default', 'binom'}, optional- Parameter specific for
type == 'default'. Sampling method for creating binary matrix used as mask for replacing aspects in data (default is'default', which means it randomly replaces one or two zeros per row;'binom'replaces random number of zeros per row). NOTE: Ignored iftypeis not'default'. f:int, optional- Parameter specific for
type == 'default'andsample_method == 'binom'. Parameter controlling average number of replaced zeros for binomial sampling (default is2). NOTE: Ignored iftypeis not'default'orsample_methodis not'binom'. processes:int, optional- Number of parallel processes to use in calculations. Iterated over
B(default is1, which means no parallel computation). random_state:int, optional- Set seed for random number generator (default is random seed).
Returns
PredictTriplot class object- Explanation object containing the main result attribute and the plot method.
Expand source code Browse git
def predict_triplot(
    self,
    new_observation,
    type="default",
    N=2000,
    B=25,
    sample_method="default",
    f=2,
    processes=1,
    random_state=None,
):
    """Calculate predict-level hierarchical aspect importance

    Parameters
    ----------
    new_observation : pd.Series or np.ndarray (1d) or pd.DataFrame (1,p)
        An observation for which a prediction needs to be explained.
    type : {'default', 'shap'}, optional
        Type of aspect importance/attributions (default is `'default'`, which means
        the use of simplified LIME method).
    N : int, optional
        Number of observations that will be sampled from the `explainer.data` attribute
        before the calculation of aspect importance (default is `2000`).
    B : int, optional
        Parameter specific for `type == 'shap'`. Number of random paths to calculate aspect
        attributions (default is `25`).
        NOTE: Ignored if `type` is not `'shap'`.
    sample_method : {'default', 'binom'}, optional
        Parameter specific for `type == 'default'`. Sampling method for creating binary matrix
        used as mask for replacing aspects in data (default is `'default'`, which means
        it randomly replaces one or two zeros per row; `'binom'` replaces random number of zeros
        per row).
        NOTE: Ignored if `type` is not `'default'`.
    f : int, optional
        Parameter specific for `type == 'default'` and `sample_method == 'binom'`. Parameter
        controlling average number of replaced zeros for binomial sampling (default is `2`).
        NOTE: Ignored if `type` is not `'default'` or `sample_method` is not `'binom'`.
    processes : int, optional
        Number of parallel processes to use in calculations. Iterated over `B`
        (default is `1`, which means no parallel computation).
    random_state : int, optional
        Set seed for random number generator (default is random seed).

    Returns
    -------
    PredictTriplot class object
        Explanation object containing the main result attribute and the plot method.
    """

    pt = PredictTriplot(type, N, B, sample_method, f, processes, random_state)

    pt.fit(self, new_observation)

    return pt
class Explainer (model, data=None, y=None, predict_function=None, residual_function=None, weights=None, label=None, model_class=None, verbose=True, precalculate=True, model_type=None, model_info=None)-
Create Model Explainer
Black-box models may have very different structures. This class creates a unified representation of a model, which can be further processed by various explanations. Methods of this class produce explanation objects, that contain the main result attribute, and can be visualised using the plot method.
The
modelis the only required parameter, but most of the explanations require that other parameters are provided (Seedata,y,predict_function,model_type).Parameters
model:object- Model to be explained.
data:pd.DataFrameornp.ndarray (2d)- Data which will be used to calculate the explanations. It shouldn't contain
the target column (See
y). NOTE: If target variable is present in the data, some of the functionalities may not work properly. y:pd.Seriesorpd.DataFrameornp.ndarray (1d)- Target variable with outputs / scores. It shall have the same length as
data. predict_function:function, optional- Function that takes two parameters (model, data) and returns a np.ndarray (1d)
with model predictions (default is predict method extracted from the model).
NOTE: This function needs to work with
dataas pd.DataFrame. residual_function:function, optional- Function that takes three parameters (model, data, y) and returns a np.ndarray (1d)
with model residuals (default is a function constructed from
predict_function). weights:pd.Seriesornp.ndarray (1d), optional- Sampling weights for observations in
data. It shall have the same length asdata(default isNone). label:str, optional- Model name to appear in result and plots (default is last element of the class attribute extracted from the model).
model_class:str, optional- Class of the model that is used e.g. to choose the
predict_function(default is the class attribute extracted from the model). NOTE: Use if your model is wrapped with Pipeline. verbose:bool- Print diagnostic messages during the Explainer initialization (default is
True). precalculate:bool- Calculate y_hat (predicted values) and residuals during the Explainer
initialization (default is
True). model_type:{'regression', 'classification', None}- Model task type that is used e.g. in
model_performance()andmodel_parts()(default is try to extract the information from the model, elseNone). model_info:dict, optional- Dict
{'model_package', 'model_package_version', ...}containing additional information to be stored.
Attributes
model:object- A model to be explained.
data:pd.DataFrame- Data which will be used to calculate the explanations.
y:np.ndarray (1d)- Target variable with outputs / scores.
predict_function:function- Function that takes two arguments (model, data) and returns np.ndarray (1d) with model predictions.
y_hat:np.ndarray (1d)- Model predictions for
data. residual_function:function- Function that takes three arguments (model, data, y) and returns np.ndarray (1d) with model residuals.
residuals:np.ndarray (1d)- Model residuals for
data. weights:np.ndarray (1d)- Sampling weights for observations in
data. label:str- Name to appear in result and plots.
model_class:str- Class of the model.
model_type:{'regression', 'classification',None}- Model task type.
model_info:dict- Dict
{'model_package', 'model_package_version', ...}containing additional information.
Notes
Expand source code Browse git
class Explainer: """ Create Model Explainer Black-box models may have very different structures. This class creates a unified representation of a model, which can be further processed by various explanations. Methods of this class produce explanation objects, that contain the main result attribute, and can be visualised using the plot method. The `model` is the only required parameter, but most of the explanations require that other parameters are provided (See `data`, `y`, `predict_function`, `model_type`). Parameters ---------- model : object Model to be explained. data : pd.DataFrame or np.ndarray (2d) Data which will be used to calculate the explanations. It shouldn't contain the target column (See `y`). NOTE: If target variable is present in the data, some of the functionalities may not work properly. y : pd.Series or pd.DataFrame or np.ndarray (1d) Target variable with outputs / scores. It shall have the same length as `data`. predict_function : function, optional Function that takes two parameters (model, data) and returns a np.ndarray (1d) with model predictions (default is predict method extracted from the model). NOTE: This function needs to work with `data` as pd.DataFrame. residual_function : function, optional Function that takes three parameters (model, data, y) and returns a np.ndarray (1d) with model residuals (default is a function constructed from `predict_function`). weights : pd.Series or np.ndarray (1d), optional Sampling weights for observations in `data`. It shall have the same length as `data` (default is `None`). label : str, optional Model name to appear in result and plots (default is last element of the class attribute extracted from the model). model_class : str, optional Class of the model that is used e.g. to choose the `predict_function` (default is the class attribute extracted from the model). NOTE: Use if your model is wrapped with Pipeline. verbose : bool Print diagnostic messages during the Explainer initialization (default is `True`). precalculate : bool Calculate y_hat (predicted values) and residuals during the Explainer initialization (default is `True`). model_type : {'regression', 'classification', None} Model task type that is used e.g. in `model_performance()` and `model_parts()` (default is try to extract the information from the model, else `None`). model_info: dict, optional Dict `{'model_package', 'model_package_version', ...}` containing additional information to be stored. Attributes -------- model : object A model to be explained. data : pd.DataFrame Data which will be used to calculate the explanations. y : np.ndarray (1d) Target variable with outputs / scores. predict_function : function Function that takes two arguments (model, data) and returns np.ndarray (1d) with model predictions. y_hat : np.ndarray (1d) Model predictions for `data`. residual_function : function Function that takes three arguments (model, data, y) and returns np.ndarray (1d) with model residuals. residuals : np.ndarray (1d) Model residuals for `data`. weights : np.ndarray (1d) Sampling weights for observations in `data`. label : str Name to appear in result and plots. model_class : str Class of the model. model_type : {'regression', 'classification', `None`} Model task type. model_info: dict Dict `{'model_package', 'model_package_version', ...}` containing additional information. Notes -------- - https://pbiecek.github.io/ema/dataSetsIntro.html#ExplainersTitanicPythonCode """ def __init__(self, model, data=None, y=None, predict_function=None, residual_function=None, weights=None, label=None, model_class=None, verbose=True, precalculate=True, model_type=None, model_info=None): # TODO: colorize helper.verbose_cat("Preparation of a new explainer is initiated\n", verbose=verbose) # REPORT: checks for data data, model = checks.check_data(data, model, verbose) # REPORT: checks for y y = checks.check_y(y, data, verbose) # REPORT: checks for weights weights = checks.check_weights(weights, data, verbose) # REPORT: checks for model_class model_class, _model_info = checks.check_model_class(model_class, model, verbose) # REPORT: checks for label label, _model_info = checks.check_label(label, model_class, _model_info, verbose) # REPORT: checks for predict_function and model_type # these two are together only because of `yhat_exception_dict` predict_function, model_type, y_hat, _model_info = \ checks.check_predict_function_and_model_type(predict_function, model_type, model, data, model_class, _model_info, precalculate, verbose) # if data is specified then we may test predict_function # at this moment we have predict function # REPORT: checks for residual_function residual_function, residuals, _model_info = checks.check_residual_function( residual_function, predict_function, model, data, y, _model_info, precalculate, verbose ) # REPORT: checks for model_info _model_info = checks.check_model_info(model_info, _model_info, verbose) # READY to create an explainer self.model = model self.data = data self.y = y self.predict_function = predict_function self.y_hat = y_hat self.residual_function = residual_function self.residuals = residuals self.model_class = model_class self.label = label self.model_info = _model_info self.weights = weights self.model_type = model_type helper.verbose_cat("\nA new explainer has been created!", verbose=verbose) def predict(self, data): """Make a prediction This function uses the `predict_function` attribute. Parameters ---------- data : pd.DataFrame, np.ndarray (2d) Data which will be used to make a prediction. Returns ---------- np.ndarray (1d) Model predictions for given `data`. """ checks.check_method_data(data) return self.predict_function(self.model, data) def residual(self, data, y): """Calculate residuals This function uses the `residual_function` attribute. Parameters ----------- data : pd.DataFrame Data which will be used to calculate residuals. y : pd.Series or np.ndarray (1d) Target variable which will be used to calculate residuals. Returns ----------- np.ndarray (1d) Model residuals for given `data` and `y`. """ checks.check_method_data(data) return self.residual_function(self.model, data, y) def predict_parts(self, new_observation, type=('break_down_interactions', 'break_down', 'shap', 'shap_wrapper'), order=None, interaction_preference=1, path="average", N=None, B=25, keep_distributions=False, label=None, processes=1, random_state=None, **kwargs): """Calculate predict-level variable attributions as Break Down, Shapley Values or Shap Values Parameters ----------- new_observation : pd.Series or np.ndarray (1d) or pd.DataFrame (1,p) An observation for which a prediction needs to be explained. type : {'break_down_interactions', 'break_down', 'shap', 'shap_wrapper'} Type of variable attributions (default is `'break_down_interactions'`). order : list of int or str, optional Parameter specific for `break_down_interactions` and `break_down`. Use a fixed order of variables for attribution calculation. Use integer values or string variable names (default is `None`, which means order by importance). interaction_preference : int, optional Parameter specific for `break_down_interactions` type. Specify which interactions will be present in an explanation. The larger the integer, the more frequently interactions will be presented (default is `1`). path : list of int, optional Parameter specific for `shap`. If specified, then attributions for this path will be plotted (default is `'average'`, which plots attribution means for `B` random paths). N : int, optional Number of observations that will be sampled from the `data` attribute before the calculation of variable attributions. Default is `None` which means all `data`. B : int, optional Parameter specific for `shap`. Number of random paths to calculate variable attributions (default is `25`). keep_distributions : bool, optional Save the distribution of partial predictions (default is `False`). label : str, optional Name to appear in result and plots. Overrides default. processes : int, optional Parameter specific for `shap`. Number of parallel processes to use in calculations. Iterated over `B` (default is `1`, which means no parallel computation). random_state : int, optional Set seed for random number generator (default is random seed). kwargs : dict Used only for `'shap_wrapper'`. Pass `shap_explainer_type` to specify, which Explainer shall be used: `{'TreeExplainer', 'DeepExplainer', 'GradientExplainer', 'LinearExplainer', 'KernelExplainer'}` (default is `None`, which automatically chooses an Explainer to use). Also keyword arguments passed to one of the: `shap.TreeExplainer.shap_values, shap.DeepExplainer.shap_values, shap.GradientExplainer.shap_values, shap.LinearExplainer.shap_values, shap.KernelExplainer.shap_values`. See https://github.com/slundberg/shap Returns ----------- BreakDown, Shap or ShapWrapper class object Explanation object containing the main result attribute and the plot method. Object class, its attributes, and the plot method depend on the `type` parameter. Notes -------- - https://pbiecek.github.io/ema/breakDown.html - https://pbiecek.github.io/ema/iBreakDown.html - https://pbiecek.github.io/ema/shapley.html - https://github.com/slundberg/shap """ checks.check_data_again(self.data) types = ('break_down_interactions', 'break_down', 'shap', 'shap_wrapper') _type = checks.check_method_type(type, types) if isinstance(N, int): # temporarly overwrite data in the Explainer (fastest way) # at the end of predict_parts fix the Explainer (add original data) if isinstance(random_state, int): np.random.seed(random_state) N = min(N, self.data.shape[0]) I = np.random.choice(np.arange(self.data.shape[0]), N, replace=False) from copy import deepcopy _data = deepcopy(self.data) self.data = self.data.iloc[I, :] if _type == 'break_down_interactions' or _type == 'break_down': _predict_parts = BreakDown( type=_type, keep_distributions=keep_distributions, order=order, interaction_preference=interaction_preference ) elif _type == 'shap': _predict_parts = Shap( keep_distributions=keep_distributions, path=path, B=B, processes=processes, random_state=random_state ) elif _type == 'shap_wrapper': _global_checks.global_check_import('shap', 'SHAP explanations') _predict_parts = ShapWrapper('predict_parts') else: raise TypeError("Wrong type parameter.") _predict_parts.fit(self, new_observation, **kwargs) if label: _predict_parts.result['label'] = label if isinstance(N, int): self.data = _data return _predict_parts def predict_profile(self, new_observation, type=('ceteris_paribus',), y=None, variables=None, grid_points=101, variable_splits=None, variable_splits_type='uniform', variable_splits_with_obs=True, processes=1, label=None, verbose=True): """Calculate predict-level variable profiles as Ceteris Paribus Parameters ----------- new_observation : pd.DataFrame or np.ndarray or pd.Series Observations for which predictions need to be explained. type : {'ceteris_paribus', TODO: 'oscilations'} Type of variable profiles (default is `'ceteris_paribus'`). y : pd.Series or np.ndarray (1d), optional Target variable with the same length as `new_observation`. variables : str or array_like of str, optional Variables for which the profiles will be calculated (default is `None`, which means all of the variables). grid_points : int, optional Maximum number of points for profile calculations (default is `101`). NOTE: The final number of points may be lower than `grid_points`, eg. if there is not enough unique values for a given variable. variable_splits : dict of lists, optional Split points for variables e.g. `{'x': [0, 0.2, 0.5, 0.8, 1], 'y': ['a', 'b']}` (default is `None`, which means that they will be calculated using one of `variable_splits_type` and the `data` attribute). variable_splits_type : {'uniform', 'quantiles'}, optional Way of calculating `variable_splits`. Set `'quantiles'` for percentiles. (default is `'uniform'`, which means uniform grid of points). variable_splits_with_obs: bool, optional Add variable values of `new_observation` data to the `variable_splits` (default is `True`). label : str, optional Name to appear in result and plots. Overrides default. processes : int, optional Number of parallel processes to use in calculations. Iterated over `variables` (default is `1`, which means no parallel computation). verbose : bool, optional Print tqdm progress bar (default is `True`). Returns ----------- CeterisParibus class object Explanation object containing the main result attribute and the plot method. Notes -------- - https://pbiecek.github.io/ema/ceterisParibus.html """ checks.check_data_again(self.data) types = ('ceteris_paribus',) _type = checks.check_method_type(type, types) if _type == 'ceteris_paribus': _predict_profile = CeterisParibus( variables=variables, grid_points=grid_points, variable_splits=variable_splits, variable_splits_type=variable_splits_type, variable_splits_with_obs=variable_splits_with_obs, processes=processes ) else: raise TypeError("Wrong type parameter.") _predict_profile.fit(self, new_observation, y, verbose) if label: _predict_profile.result['_label_'] = label return _predict_profile def predict_surrogate(self, new_observation, type='lime', **kwargs): """Wrapper for surrogate model explanations This function uses the lime package to create the model explanation. See https://lime-ml.readthedocs.io/en/latest/lime.html#module-lime.lime_tabular Parameters ----------- new_observation : pd.Series or np.ndarray (1d) or pd.DataFrame (1,p) An observation for which a prediction needs to be explained. type : {'lime'} Type of explanation method (default is `'lime'`, which uses the lime package to create an explanation). kwargs : dict Keyword arguments passed to the lime.lime_tabular.LimeTabularExplainer object and the LimeTabularExplainer.explain_instance method. Exceptions are: `training_data`, `mode`, `data_row` and `predict_fn`. Other parameters: https://lime-ml.readthedocs.io/en/latest/lime.html#module-lime.lime_tabular Returns ----------- lime.explanation.Explanation Explanation object. Notes ----------- - https://github.com/marcotcr/lime """ checks.check_data_again(self.data) if type == 'lime': _global_checks.global_check_import('lime', 'LIME explanations') _new_observation = checks.check_new_observation_lime(new_observation) _explanation = utils.create_lime_explanation(self, _new_observation, **kwargs) else: raise TypeError("Wrong 'type' parameter.") return _explanation def model_performance(self, model_type=None, cutoff=0.5, label=None): """Calculate model-level model performance measures Parameters ----------- model_type : {'regression', 'classification', None} Model task type that is used to choose the proper performance measures (default is `None`, which means try to extract from the `model_type` attribute). cutoff : float, optional Cutoff for predictions in classification models. Needed for measures like recall, precision, acc, f1 (default is `0.5`). label : str, optional Name to appear in result and plots. Overrides default. Returns ----------- ModelPerformance class object Explanation object containing the main result attribute and the plot method. Notes -------- - https://pbiecek.github.io/ema/modelPerformance.html """ checks.check_data_again(self.data) checks.check_y_again(self.y) if model_type is None and self.model_type is None: raise TypeError("if self.model_type is None, then model_type must be not None") elif model_type is None: model_type = self.model_type _model_performance = ModelPerformance( model_type=model_type, cutoff=cutoff ) _model_performance.fit(self) if label: _model_performance.result['label'] = label return _model_performance def model_parts(self, loss_function=None, type=('variable_importance', 'ratio', 'difference', 'shap_wrapper'), N=1000, B=10, variables=None, variable_groups=None, keep_raw_permutations=True, label=None, processes=1, random_state=None, **kwargs): """Calculate model-level variable importance Parameters ----------- loss_function : {'rmse', '1-auc', 'mse', 'mae', 'mad'} or function, optional If string, then such loss function will be used to assess variable importance (default is `'rmse'` or `'1-auc'`, depends on `model_type` attribute). type : {'variable_importance', 'ratio', 'difference', 'shap_wrapper'} Type of transformation that will be applied to dropout loss. (default is `'variable_importance'`, which is Permutational Variable Importance). N : int, optional Number of observations that will be sampled from the `data` attribute before the calculation of variable importance. `None` means all `data` (default is `1000`). B : int, optional Number of permutation rounds to perform on each variable (default is `10`). variables : array_like of str, optional Variables for which the importance will be calculated (default is `None`, which means all of the variables). NOTE: Ignored if `variable_groups` is not `None`. variable_groups : dict of lists, optional Group the variables to calculate their joint variable importance e.g. `{'X': ['x1', 'x2'], 'Y': ['y1', 'y2']}` (default is `None`). keep_raw_permutations: bool, optional Save results for all permutation rounds (default is `True`). label : str, optional Name to appear in result and plots. Overrides default. processes : int, optional Number of parallel processes to use in calculations. Iterated over `B` (default is `1`, which means no parallel computation). random_state : int, optional Set seed for random number generator (default is random seed). kwargs : dict Used only for 'shap_wrapper'. Pass `shap_explainer_type` to specify, which Explainer shall be used: `{'TreeExplainer', 'DeepExplainer', 'GradientExplainer', 'LinearExplainer', 'KernelExplainer'}`. Also keyword arguments passed to one of the: `shap.TreeExplainer.shap_values, shap.DeepExplainer.shap_values, shap.GradientExplainer.shap_values, shap.LinearExplainer.shap_values, shap.KernelExplainer.shap_values`. See https://github.com/slundberg/shap Returns ----------- VariableImportance or ShapWrapper class object Explanation object containing the main result attribute and the plot method. Object class, its attributes, and the plot method depend on the `type` parameter. Notes -------- - https://pbiecek.github.io/ema/featureImportance.html - https://github.com/slundberg/shap """ checks.check_data_again(self.data) types = ('variable_importance', 'ratio', 'difference', 'shap_wrapper') aliases = {'permutational': 'variable_importance', 'feature_importance': 'variable_importance'} _type = checks.check_method_type(type, types, aliases) loss_function = checks.check_method_loss_function(self, loss_function) if _type != 'shap_wrapper': checks.check_y_again(self.y) _model_parts = VariableImportance( loss_function=loss_function, type=_type, N=N, B=B, variables=variables, variable_groups=variable_groups, processes=processes, random_state=random_state, keep_raw_permutations=keep_raw_permutations, ) _model_parts.fit(self) if label: _model_parts.result['label'] = label elif _type == 'shap_wrapper': _global_checks.global_check_import('shap', 'SHAP explanations') _model_parts = ShapWrapper('model_parts') if isinstance(N, int): if isinstance(random_state, int): np.random.seed(random_state) N = min(N, self.data.shape[0]) I = np.random.choice(np.arange(self.data.shape[0]), N, replace=False) _new_observation = self.data.iloc[I, :] else: _new_observation = self.data _model_parts.fit(self, _new_observation, **kwargs) else: raise TypeError("Wrong type parameter"); return _model_parts def model_profile(self, type=('partial', 'accumulated', 'conditional'), N=300, variables=None, variable_type='numerical', groups=None, span=0.25, grid_points=101, variable_splits=None, variable_splits_type='uniform', center=True, label=None, processes=1, random_state=None, verbose=True): """Calculate model-level variable profiles as Partial or Accumulated Dependence Parameters ----------- type : {'partial', 'accumulated', 'conditional'} Type of model profiles (default is `'partial'` for Partial Dependence Profiles). N : int, optional Number of observations that will be sampled from the `data` attribute before the calculation of variable profiles. `None` means all `data` (default is `300`). variables : str or array_like of str, optional Variables for which the profiles will be calculated (default is `None`, which means all of the variables). variable_type : {'numerical', 'categorical'} Calculate the profiles for numerical or categorical variables (default is `'numerical'`). groups : str or array_like of str, optional Names of categorical variables that will be used for profile grouping (default is `None`, which means no grouping). span : float, optional Smoothing coefficient used as sd for gaussian kernel (default is `0.25`). grid_points : int, optional Maximum number of points for profile calculations (default is `101`). NOTE: The final number of points may be lower than `grid_points`, e.g. if there is not enough unique values for a given variable. variable_splits : dict of lists, optional Split points for variables e.g. `{'x': [0, 0.2, 0.5, 0.8, 1], 'y': ['a', 'b']}` (default is `None`, which means that they will be distributed uniformly). variable_splits_type : {'uniform', 'quantiles'}, optional Way of calculating `variable_splits`. Set 'quantiles' for percentiles. (default is `'uniform'`, which means uniform grid of points). center : bool, optional Theoretically Accumulated Profiles start at `0`, but are centered to compare them with Partial Dependence Profiles (default is `True`, which means center around the average `y_hat` calculated on the data sample). label : str, optional Name to appear in result and plots. Overrides default. processes : int, optional Number of parallel processes to use in calculations. Iterated over `variables` (default is `1`, which means no parallel computation). random_state : int, optional Set seed for random number generator (default is random seed). verbose : bool, optional Print tqdm progress bar (default is `True`). Returns ----------- AggregatedProfiles class object Explanation object containing the main result attribute and the plot method. Notes -------- - https://pbiecek.github.io/ema/partialDependenceProfiles.html - https://pbiecek.github.io/ema/accumulatedLocalProfiles.html """ checks.check_data_again(self.data) types = ('partial', 'accumulated', 'conditional') aliases = {'pdp': 'partial', 'ale': 'accumulated'} _type = checks.check_method_type(type, types, aliases) _ceteris_paribus = CeterisParibus( grid_points=grid_points, variables=variables, variable_splits=variable_splits, variable_splits_type=variable_splits_type, processes=processes ) if isinstance(N, int): if isinstance(random_state, int): np.random.seed(random_state) N = min(N, self.data.shape[0]) I = np.random.choice(np.arange(self.data.shape[0]), N, replace=False) _y = self.y[I] if self.y is not None else self.y _new_observation = self.data.iloc[I, :] else: _y = self.y _new_observation = self.data _ceteris_paribus.fit(self, _new_observation, _y, verbose=verbose) _model_profile = AggregatedProfiles( type=_type, variables=variables, variable_type=variable_type, groups=groups, span=span, center=center, random_state=random_state ) _model_profile.fit(_ceteris_paribus, verbose) if label: _model_profile.result['_label_'] = label return _model_profile def model_diagnostics(self, variables=None, label=None): """Calculate model-level residuals diagnostics Parameters ----------- variables : str or array_like of str, optional Variables for which the data will be calculated (default is `None`, which means all of the variables). label : str, optional Name to appear in result and plots. Overrides default. Returns ----------- ResidualDiagnostics class object Explanation object containing the main result attribute and the plot method. Notes -------- - https://pbiecek.github.io/ema/residualDiagnostic.html """ checks.check_data_again(self.data) checks.check_y_again(self.y) _residual_diagnostics = ResidualDiagnostics( variables=variables ) _residual_diagnostics.fit(self) if label: _residual_diagnostics.result['label'] = label return _residual_diagnostics def model_surrogate(self, type=('tree', 'linear'), max_vars=5, max_depth=3, **kwargs): """Create a surrogate interpretable model from the black-box model This method uses the scikit-learn package to create a surrogate interpretable model (e.g. decision tree) from the black-box model. It aims to use the most important features and add a plot method to the model, so that it can be easily interpreted. See Notes section for references. Parameters ----------- type : {'tree', 'linear'} Type of a surrogate model. This can be a decision tree or a linear model (default is `'tree'`). max_vars : int, optional Maximum number of variables that will be used in surrogate model training. These are the most important variables to the black-box model (default is `5`). max_depth : int, optional The maximum depth of the tree. If `None`, then nodes are expanded until all leaves are pure or until all leaves contain less than min_samples_split samples (default is `3` for interpretable plot). kwargs : dict Keyword arguments passed to one of the: `sklearn.tree.DecisionTreeClassifier, sklearn.tree.DecisionTreeRegressor, sklearn.linear_model.LogisticRegression, sklearn.linear_model.LinearRegression` Returns ----------- One of: sklearn.tree.DecisionTreeClassifier, sklearn.tree.DecisionTreeRegressor, sklearn.linear_model.LogisticRegression, sklearn.linear_model.LinearRegression A surrogate model with additional: - `plot` method - `performance` attribute - `feature_names` attribute - `class_names` attribute Notes ----------- - https://christophm.github.io/interpretable-ml-book/global.html - https://github.com/scikit-learn/scikit-learn """ _global_checks.global_check_import('scikit-learn', 'surrogate models') checks.check_data_again(self.data) types = ('tree', 'linear') _type = checks.check_method_type(type, types) surrogate_model = utils.create_surrogate_model(explainer=self, type=_type, max_vars=max_vars, max_depth=max_depth, **kwargs) return surrogate_model def model_fairness(self, protected, privileged, cutoff=0.5, epsilon=0.8, label=None, **kwargs): """Creates a model-level fairness explanation that enables bias detection This method returns a GroupFairnessClassification or a GroupFairnessRegression object depending of the type of predictor. They work as a wrapper of the protected attribute and the Explainer from which `y` and `y_hat` attributes were extracted. Along with an information about privileged subgroup (value in the `protected` parameter), those 3 vectors create triplet `(y, y_hat, protected)` which is a base for all further fairness calculations and visualizations. The GroupFairnessRegression should be treated as experimental tool. It was implemented according to Fairness Measures for Regression via Probabilistic Classification - Steinberg et al. (2020). Parameters ----------- protected : np.ndarray (1d) Vector, preferably 1-dimensional np.ndarray containing strings, which denotes the membership to a subgroup. It doesn't have to be binary. It doesn't need to be in data. It is sometimes suggested not to use sensitive attributes in modelling, but still check model bias for them. NOTE: List and pd.Series are also supported; however, if provided, they will be transformed into a np.ndarray (1d) with dtype 'U'. privileged : str Subgroup that is suspected to have the most privilege. It needs to be a string present in `protected`. cutoff : float or dict, optional Only for classification models. Threshold for probabilistic output of a classifier. It might be: a `float` - same for all subgroups from `protected`, or a `dict` - individually adjusted for each subgroup; must have values from `protected` as keys. epsilon : float Parameter defines acceptable fairness scores. The closer to `1` the more strict the verdict is. If the ratio of certain unprivileged and privileged subgroup is within the `(epsilon, 1/epsilon)` range, then there is no discrimination in this metric and for this subgroups (default is `0.8`). label : str, optional Name to appear in result and plots. Overrides default. kwargs : dict Keyword arguments. It supports `verbose`, which is a boolean value telling if additional output should be printed (`True`) or not (`False`, default). Returns ----------- GroupFairnessClassification class object (a subclass of _FairnessObject) Explanation object containing the main result attribute and the plot method. It has the following main attributes: - result : `pd.DataFrame` Scaled `metric_scores`. The scaling is performed by dividing all metric scores by scores of the privileged subgroup. - metric_scores : `pd.DataFrame` Raw metric scores for each subgroup. - parity_loss : `pd.Series` It is a summarised `result`. From each metric (column) a logarithm is calculated, then the absolute value is taken and summarised. Therefore, for metric M: `parity_loss` is a `sum(abs(log(M_i / M_privileged)))` where `M_i` is the metric score for subgroup `i`. - label : `str` `label` attribute from the Explainer object. Labels must be unique when plotting. - cutoff : `dict` A float value for each subgroup (key in dict). Notes ----------- - Verma, S. & Rubin, J. (2018) https://fairware.cs.umass.edu/papers/Verma.pdf - Zafar, M.B., et al. (2017) https://arxiv.org/pdf/1610.08452.pdf - Hardt, M., et al. (2016) https://arxiv.org/pdf/1610.02413.pdf - Steinberg, D., et al. (2020) https://arxiv.org/pdf/2001.06089.pdf """ if self.model_type == 'classification': fobject = GroupFairnessClassification(y=self.y, y_hat=self.y_hat, protected=protected, privileged=privileged, cutoff=cutoff, epsilon=epsilon, label=self.label, **kwargs) elif self.model_type == 'regression': fobject = GroupFairnessRegression(y=self.y, y_hat=self.y_hat, protected=protected, privileged=privileged, epsilon=epsilon, label=self.label, **kwargs) else : raise ValueError("'model_type' must be either 'classification' or 'regression'") if label: fobject.label = label return fobject def dumps(self, *args, **kwargs): """Return the pickled representation (bytes object) of the Explainer This method uses the pickle package. See https://docs.python.org/3/library/pickle.html#pickle.dumps NOTE: local functions and lambdas cannot be pickled. Attribute `residual_function` by default contains lambda; thus, if not provided by the user, it will be dropped before the dump. Parameters ----------- args : dict Positional arguments passed to the pickle.dumps function. kwargs : dict Keyword arguments passed to the pickle.dumps function. Returns ----------- bytes object """ from copy import deepcopy to_dump = deepcopy(self) to_dump = checks.check_if_local_and_lambda(to_dump) import pickle return pickle.dumps(to_dump, *args, **kwargs) def dump(self, file, *args, **kwargs): """Write the pickled representation of the Explainer to the file (pickle) This method uses the pickle package. See https://docs.python.org/3/library/pickle.html#pickle.dump NOTE: local functions and lambdas cannot be pickled. Attribute `residual_function` by default contains lambda; thus, if not provided by the user, it will be dropped before the dump. Parameters ----------- file : ... A file object opened for binary writing, or an io.BytesIO instance. args : dict Positional arguments passed to the pickle.dump function. kwargs : dict Keyword arguments passed to the pickle.dump function. """ from copy import deepcopy to_dump = deepcopy(self) to_dump = checks.check_if_local_and_lambda(to_dump) import pickle return pickle.dump(to_dump, file, *args, **kwargs) @staticmethod def loads(data, use_defaults=True, *args, **kwargs): """Load the Explainer from the pickled representation (bytes object) This method uses the pickle package. See https://docs.python.org/3/library/pickle.html#pickle.loads NOTE: local functions and lambdas cannot be pickled. If `use_defaults` is set to `True`, then dropped functions are set to defaults. Parameters ----------- data : bytes object Binary representation of the Explainer. use_defaults : bool Replace empty `predict_function` and `residual_function` with default values like in Explainer initialization (default is `True`). args : dict Positional arguments passed to the pickle.loads function. kwargs : dict Keyword arguments passed to the pickle.loads function. Returns ----------- Explainer object """ import pickle exp = pickle.loads(data, *args, **kwargs) if use_defaults: exp = checks.check_if_empty_fields(exp) return exp @staticmethod def load(file, use_defaults=True, *args, **kwargs): """Read the pickled representation of the Explainer from the file (pickle) This method uses the pickle package. See https://docs.python.org/3/library/pickle.html#pickle.load NOTE: local functions and lambdas cannot be pickled. If `use_defaults` is set to `True`, then dropped functions are set to defaults. Parameters ----------- file : ... A binary file object opened for reading, or an io.BytesIO object. use_defaults : bool Replace empty `predict_function` and `residual_function` with default values like in Explainer initialization (default is `True`). args : dict Positional arguments passed to the pickle.load function. kwargs : dict Keyword arguments passed to the pickle.load function. Returns ----------- Explainer object """ import pickle exp = pickle.load(file, *args, **kwargs) if use_defaults: exp = checks.check_if_empty_fields(exp) return expStatic methods
def load(file, use_defaults=True, *args, **kwargs)-
Read the pickled representation of the Explainer from the file (pickle)
This method uses the pickle package. See https://docs.python.org/3/library/pickle.html#pickle.load
NOTE: local functions and lambdas cannot be pickled. If
use_defaultsis set toTrue, then dropped functions are set to defaults.Parameters
- file : …
- A binary file object opened for reading, or an io.BytesIO object.
use_defaults:bool- Replace empty
predict_functionandresidual_functionwith default values like in Explainer initialization (default isTrue). args:dict- Positional arguments passed to the pickle.load function.
kwargs:dict- Keyword arguments passed to the pickle.load function.
Returns
Explainer object
Expand source code Browse git
@staticmethod
def load(file, use_defaults=True, *args, **kwargs):
    """Read the pickled representation of the Explainer from the file (pickle)

    This method uses the pickle package. See
    https://docs.python.org/3/library/pickle.html#pickle.load

    NOTE: local functions and lambdas cannot be pickled.
    If `use_defaults` is set to `True`, then dropped functions are set to defaults.

    Parameters
    -----------
    file : ...
        A binary file object opened for reading, or an io.BytesIO object.
    use_defaults : bool
        Replace empty `predict_function` and `residual_function` with default
        values like in Explainer initialization (default is `True`).
    args : dict
        Positional arguments passed to the pickle.load function.
    kwargs : dict
        Keyword arguments passed to the pickle.load function.

    Returns
    -----------
    Explainer object
    """

    import pickle
    exp = pickle.load(file, *args, **kwargs)

    if use_defaults:
        exp = checks.check_if_empty_fields(exp)

    return exp
def loads(data, use_defaults=True, *args, **kwargs)-
Load the Explainer from the pickled representation (bytes object)
This method uses the pickle package. See https://docs.python.org/3/library/pickle.html#pickle.loads
NOTE: local functions and lambdas cannot be pickled. If
use_defaultsis set toTrue, then dropped functions are set to defaults.Parameters
data:bytes object- Binary representation of the Explainer.
use_defaults:bool- Replace empty
predict_functionandresidual_functionwith default values like in Explainer initialization (default isTrue). args:dict- Positional arguments passed to the pickle.loads function.
kwargs:dict- Keyword arguments passed to the pickle.loads function.
Returns
Explainer object
Expand source code Browse git
@staticmethod
def loads(data, use_defaults=True, *args, **kwargs):
    """Load the Explainer from the pickled representation (bytes object)

    This method uses the pickle package. See
    https://docs.python.org/3/library/pickle.html#pickle.loads

    NOTE: local functions and lambdas cannot be pickled.
    If `use_defaults` is set to `True`, then dropped functions are set to defaults.

    Parameters
    -----------
    data : bytes object
        Binary representation of the Explainer.
    use_defaults : bool
        Replace empty `predict_function` and `residual_function` with default
        values like in Explainer initialization (default is `True`).
    args : dict
        Positional arguments passed to the pickle.loads function.
    kwargs : dict
        Keyword arguments passed to the pickle.loads function.

    Returns
    -----------
    Explainer object
    """

    import pickle
    exp = pickle.loads(data, *args, **kwargs)

    if use_defaults:
        exp = checks.check_if_empty_fields(exp)

    return exp
Methods
def dump(self, file, *args, **kwargs)-
Write the pickled representation of the Explainer to the file (pickle)
This method uses the pickle package. See https://docs.python.org/3/library/pickle.html#pickle.dump
NOTE: local functions and lambdas cannot be pickled. Attribute
residual_functionby default contains lambda; thus, if not provided by the user, it will be dropped before the dump.Parameters
- file : …
- A file object opened for binary writing, or an io.BytesIO instance.
args:dict- Positional arguments passed to the pickle.dump function.
kwargs:dict- Keyword arguments passed to the pickle.dump function.
Expand source code Browse git
def dump(self, file, *args, **kwargs):
    """Write the pickled representation of the Explainer to the file (pickle)

    This method uses the pickle package. See
    https://docs.python.org/3/library/pickle.html#pickle.dump

    NOTE: local functions and lambdas cannot be pickled.
    Attribute `residual_function` by default contains lambda; thus,
    if not provided by the user, it will be dropped before the dump.

    Parameters
    -----------
    file : ...
        A file object opened for binary writing, or an io.BytesIO instance.
    args : dict
        Positional arguments passed to the pickle.dump function.
    kwargs : dict
        Keyword arguments passed to the pickle.dump function.
    """

    from copy import deepcopy
    to_dump = deepcopy(self)
    to_dump = checks.check_if_local_and_lambda(to_dump)

    import pickle
    return pickle.dump(to_dump, file, *args, **kwargs)
def dumps(self, *args, **kwargs)-
Return the pickled representation (bytes object) of the Explainer
This method uses the pickle package. See https://docs.python.org/3/library/pickle.html#pickle.dumps
NOTE: local functions and lambdas cannot be pickled. Attribute
residual_functionby default contains lambda; thus, if not provided by the user, it will be dropped before the dump.Parameters
args:dict- Positional arguments passed to the pickle.dumps function.
kwargs:dict- Keyword arguments passed to the pickle.dumps function.
Returns
bytes object
Expand source code Browse git
def dumps(self, *args, **kwargs):
    """Return the pickled representation (bytes object) of the Explainer

    This method uses the pickle package. See
    https://docs.python.org/3/library/pickle.html#pickle.dumps

    NOTE: local functions and lambdas cannot be pickled.
    Attribute `residual_function` by default contains lambda; thus,
    if not provided by the user, it will be dropped before the dump.

    Parameters
    -----------
    args : dict
        Positional arguments passed to the pickle.dumps function.
    kwargs : dict
        Keyword arguments passed to the pickle.dumps function.

    Returns
    -----------
    bytes object
    """

    from copy import deepcopy
    to_dump = deepcopy(self)
    to_dump = checks.check_if_local_and_lambda(to_dump)

    import pickle
    return pickle.dumps(to_dump, *args, **kwargs)
def model_diagnostics(self, variables=None, label=None)-
Calculate model-level residuals diagnostics
Parameters
variables:strorarray_likeofstr, optional- Variables for which the data will be calculated
(default is
None, which means all of the variables). label:str, optional- Name to appear in result and plots. Overrides default.
Returns
ResidualDiagnostics class object- Explanation object containing the main result attribute and the plot method.
Notes
Expand source code Browse git
def model_diagnostics(self,
                      variables=None,
                      label=None):
    """Calculate model-level residuals diagnostics

    Parameters
    -----------
    variables : str or array_like of str, optional
        Variables for which the data will be calculated
        (default is `None`, which means all of the variables).
    label : str, optional
        Name to appear in result and plots. Overrides default.

    Returns
    -----------
    ResidualDiagnostics class object
        Explanation object containing the main result attribute and the plot method.

    Notes
    --------
    - https://pbiecek.github.io/ema/residualDiagnostic.html
    """

    checks.check_data_again(self.data)
    checks.check_y_again(self.y)

    _residual_diagnostics = ResidualDiagnostics(
        variables=variables
    )
    _residual_diagnostics.fit(self)

    if label:
        _residual_diagnostics.result['label'] = label

    return _residual_diagnostics
def model_fairness(self, protected, privileged, cutoff=0.5, epsilon=0.8, label=None, **kwargs)-
Creates a model-level fairness explanation that enables bias detection
This method returns a GroupFairnessClassification or a GroupFairnessRegression object depending of the type of predictor. They work as a wrapper of the protected attribute and the Explainer from which
yandy_hatattributes were extracted. Along with an information about privileged subgroup (value in theprotectedparameter), those 3 vectors create triplet(y, y_hat, protected)which is a base for all further fairness calculations and visualizations.The GroupFairnessRegression should be treated as experimental tool. It was implemented according to Fairness Measures for Regression via Probabilistic Classification - Steinberg et al. (2020).
Parameters
protected:np.ndarray (1d)- Vector, preferably 1-dimensional np.ndarray containing strings, which denotes the membership to a subgroup. It doesn't have to be binary. It doesn't need to be in data. It is sometimes suggested not to use sensitive attributes in modelling, but still check model bias for them. NOTE: List and pd.Series are also supported; however, if provided, they will be transformed into a np.ndarray (1d) with dtype 'U'.
privileged:str- Subgroup that is suspected to have the most privilege.
It needs to be a string present in
protected. cutoff:floatordict, optional- Only for classification models.
Threshold for probabilistic output of a classifier.
It might be: a
float- same for all subgroups fromprotected, or adict- individually adjusted for each subgroup; must have values fromprotectedas keys. epsilon:float- Parameter defines acceptable fairness scores. The closer to
1the more strict the verdict is. If the ratio of certain unprivileged and privileged subgroup is within the(epsilon, 1/epsilon)range, then there is no discrimination in this metric and for this subgroups (default is0.8). label:str, optional- Name to appear in result and plots. Overrides default.
kwargs:dict- Keyword arguments. It supports
verbose, which is a boolean value telling if additional output should be printed (True) or not (False, default).
Returns
GroupFairnessClassification class object (a subclassof_FairnessObject)- Explanation object containing the main result attribute and the plot method.
It has the following main attributes:-
- result :
pd.DataFrameScaledmetric_scores. The scaling is performed by dividing all metric scores by scores of the privileged subgroup. - metric_scores :
pd.DataFrameRaw metric scores for each subgroup. - parity_loss :
pd.SeriesIt is a summarisedresult. From each metric (column) a logarithm is calculated, then the absolute value is taken and summarised. Therefore, for metric M:parity_lossis asum(abs(log(M_i / M_privileged)))whereM_iis the metric score for subgroupi. - label :
strlabelattribute from the Explainer object. Labels must be unique when plotting. - cutoff :
dictA float value for each subgroup (key in dict).
- result :
Notes
- Verma, S. & Rubin, J. (2018) https://fairware.cs.umass.edu/papers/Verma.pdf
- Zafar, M.B., et al. (2017) https://arxiv.org/pdf/1610.08452.pdf
- Hardt, M., et al. (2016) https://arxiv.org/pdf/1610.02413.pdf
- Steinberg, D., et al. (2020) https://arxiv.org/pdf/2001.06089.pdf
Expand source code Browse git
def model_fairness(self,
                   protected,
                   privileged,
                   cutoff=0.5,
                   epsilon=0.8,
                   label=None,
                   **kwargs):
    """Creates a model-level fairness explanation that enables bias detection

    This method returns a GroupFairnessClassification or a GroupFairnessRegression
    object depending of the type of predictor. They work as a wrapper of the
    protected attribute and the Explainer from which `y` and `y_hat`
    attributes were extracted. Along with an information about
    privileged subgroup (value in the `protected` parameter), those 3 vectors
    create triplet `(y, y_hat, protected)` which is a base for all further
    fairness calculations and visualizations.

    The GroupFairnessRegression should be treated as experimental tool.
    It was implemented according to Fairness Measures for Regression via
    Probabilistic Classification - Steinberg et al. (2020).

    Parameters
    -----------
    protected : np.ndarray (1d)
        Vector, preferably 1-dimensional np.ndarray containing strings,
        which denotes the membership to a subgroup. It doesn't have to be binary.
        It doesn't need to be in data. It is sometimes suggested not to use
        sensitive attributes in modelling, but still check model bias for them.
        NOTE: List and pd.Series are also supported; however, if provided,
        they will be transformed into a np.ndarray (1d) with dtype 'U'.
    privileged : str
        Subgroup that is suspected to have the most privilege.
        It needs to be a string present in `protected`.
    cutoff : float or dict, optional
        Only for classification models.
        Threshold for probabilistic output of a classifier.
        It might be: a `float` - same for all subgroups from `protected`,
        or a `dict` - individually adjusted for each subgroup;
        must have values from `protected` as keys.
    epsilon : float
        Parameter defines acceptable fairness scores. The closer to `1` the
        more strict the verdict is. If the ratio of certain unprivileged
        and privileged subgroup is within the `(epsilon, 1/epsilon)` range,
        then there is no discrimination in this metric and for this subgroups
        (default is `0.8`).
    label : str, optional
        Name to appear in result and plots. Overrides default.
    kwargs : dict
        Keyword arguments. It supports `verbose`, which is a boolean
        value telling if additional output should be printed
        (`True`) or not (`False`, default).

    Returns
    -----------
    GroupFairnessClassification class object (a subclass of _FairnessObject)
        Explanation object containing the main result attribute and the plot method.

    It has the following main attributes:
        - result : `pd.DataFrame`
            Scaled `metric_scores`. The scaling is performed by
            dividing all metric scores by scores of the privileged subgroup.
        - metric_scores : `pd.DataFrame`
            Raw metric scores for each subgroup.
        - parity_loss : `pd.Series`
            It is a summarised `result`. From each metric (column) a logarithm
            is calculated, then the absolute value is taken and summarised.
            Therefore, for metric M:
                `parity_loss` is a `sum(abs(log(M_i / M_privileged)))`
                    where `M_i` is the metric score for subgroup `i`.
        - label : `str`
            `label` attribute from the Explainer object.
                Labels must be unique when plotting.
        - cutoff : `dict`
            A float value for each subgroup (key in dict).

    Notes
    -----------
    - Verma, S. & Rubin, J. (2018) https://fairware.cs.umass.edu/papers/Verma.pdf
    - Zafar, M.B., et al. (2017) https://arxiv.org/pdf/1610.08452.pdf
    - Hardt, M., et al. (2016) https://arxiv.org/pdf/1610.02413.pdf
    - Steinberg, D., et al. (2020) https://arxiv.org/pdf/2001.06089.pdf
    """

    if self.model_type == 'classification':
        fobject = GroupFairnessClassification(y=self.y,
                                              y_hat=self.y_hat,
                                              protected=protected,
                                              privileged=privileged,
                                              cutoff=cutoff,
                                              epsilon=epsilon,
                                              label=self.label,
                                              **kwargs)

    elif self.model_type == 'regression':
        fobject = GroupFairnessRegression(y=self.y,
                                          y_hat=self.y_hat,
                                          protected=protected,
                                          privileged=privileged,
                                          epsilon=epsilon,
                                          label=self.label,
                                          **kwargs)

    else :
        raise ValueError("'model_type' must be either 'classification' or 'regression'")

    if label:
         fobject.label = label

    return fobject
def model_parts(self, loss_function=None, type=('variable_importance', 'ratio', 'difference', 'shap_wrapper'), N=1000, B=10, variables=None, variable_groups=None, keep_raw_permutations=True, label=None, processes=1, random_state=None, **kwargs)-
Calculate model-level variable importance
Parameters
loss_function:{'rmse', '1-auc', 'mse', 'mae', 'mad'}orfunction, optional- If string, then such loss function will be used to assess variable importance
(default is
'rmse'or'1-auc', depends onmodel_typeattribute). type:{'variable_importance', 'ratio', 'difference', 'shap_wrapper'}- Type of transformation that will be applied to dropout loss.
(default is
'variable_importance', which is Permutational Variable Importance). N:int, optional- Number of observations that will be sampled from the
dataattribute before the calculation of variable importance.Nonemeans alldata(default is1000). B:int, optional- Number of permutation rounds to perform on each variable (default is
10). variables:array_likeofstr, optional- Variables for which the importance will be calculated
(default is
None, which means all of the variables). NOTE: Ignored ifvariable_groupsis notNone. variable_groups:dictoflists, optional- Group the variables to calculate their joint variable importance
e.g.
{'X': ['x1', 'x2'], 'Y': ['y1', 'y2']}(default isNone). keep_raw_permutations:bool, optional- Save results for all permutation rounds (default is
True). label:str, optional- Name to appear in result and plots. Overrides default.
processes:int, optional- Number of parallel processes to use in calculations. Iterated over
B(default is1, which means no parallel computation). random_state:int, optional- Set seed for random number generator (default is random seed).
kwargs:dict- Used only for 'shap_wrapper'. Pass
shap_explainer_typeto specify, which Explainer shall be used:{'TreeExplainer', 'DeepExplainer', 'GradientExplainer', 'LinearExplainer', 'KernelExplainer'}. Also keyword arguments passed to one of the:shap.TreeExplainer.shap_values, shap.DeepExplainer.shap_values, shap.GradientExplainer.shap_values, shap.LinearExplainer.shap_values, shap.KernelExplainer.shap_values. See https://github.com/slundberg/shap
Returns
VariableImportanceorShapWrapper class object- Explanation object containing the main result attribute and the plot method.
Object class, its attributes, and the plot method depend on the
typeparameter.
Notes
Expand source code Browse git
def model_parts(self,
                loss_function=None,
                type=('variable_importance', 'ratio', 'difference', 'shap_wrapper'),
                N=1000,
                B=10,
                variables=None,
                variable_groups=None,
                keep_raw_permutations=True,
                label=None,
                processes=1,
                random_state=None,
                **kwargs):

    """Calculate model-level variable importance

    Parameters
    -----------
    loss_function : {'rmse', '1-auc', 'mse', 'mae', 'mad'} or function, optional
        If string, then such loss function will be used to assess variable importance
        (default is `'rmse'` or `'1-auc'`, depends on `model_type` attribute).
    type : {'variable_importance', 'ratio', 'difference', 'shap_wrapper'}
        Type of transformation that will be applied to dropout loss.
        (default is `'variable_importance'`, which is Permutational Variable Importance).
    N : int, optional
        Number of observations that will be sampled from the `data` attribute before
        the calculation of variable importance. `None` means all `data` (default is `1000`).
    B : int, optional
        Number of permutation rounds to perform on each variable (default is `10`).
    variables : array_like of str, optional
        Variables for which the importance will be calculated
        (default is `None`, which means all of the variables).
        NOTE: Ignored if `variable_groups` is not `None`.
    variable_groups : dict of lists, optional
        Group the variables to calculate their joint variable importance
        e.g. `{'X': ['x1', 'x2'], 'Y': ['y1', 'y2']}` (default is `None`).
    keep_raw_permutations: bool, optional
        Save results for all permutation rounds (default is `True`).
    label : str, optional
        Name to appear in result and plots. Overrides default.
    processes : int, optional
        Number of parallel processes to use in calculations. Iterated over `B`
        (default is `1`, which means no parallel computation).
    random_state : int, optional
        Set seed for random number generator (default is random seed).
    kwargs : dict
        Used only for 'shap_wrapper'. Pass `shap_explainer_type` to specify, which
        Explainer shall be used: `{'TreeExplainer', 'DeepExplainer', 'GradientExplainer',
        'LinearExplainer', 'KernelExplainer'}`.
        Also keyword arguments passed to one of the: `shap.TreeExplainer.shap_values,
        shap.DeepExplainer.shap_values, shap.GradientExplainer.shap_values,
        shap.LinearExplainer.shap_values, shap.KernelExplainer.shap_values`.
        See https://github.com/slundberg/shap

    Returns
    -----------
    VariableImportance or ShapWrapper class object
        Explanation object containing the main result attribute and the plot method.
        Object class, its attributes, and the plot method depend on the `type` parameter.

    Notes
    --------
    - https://pbiecek.github.io/ema/featureImportance.html
    - https://github.com/slundberg/shap
    """

    checks.check_data_again(self.data)

    types = ('variable_importance', 'ratio', 'difference', 'shap_wrapper')
    aliases = {'permutational': 'variable_importance', 'feature_importance': 'variable_importance'}
    _type = checks.check_method_type(type, types, aliases)

    loss_function = checks.check_method_loss_function(self, loss_function)

    if _type != 'shap_wrapper':
        checks.check_y_again(self.y)

        _model_parts = VariableImportance(
            loss_function=loss_function,
            type=_type,
            N=N,
            B=B,
            variables=variables,
            variable_groups=variable_groups,
            processes=processes,
            random_state=random_state,
            keep_raw_permutations=keep_raw_permutations,
        )
        _model_parts.fit(self)

        if label:
            _model_parts.result['label'] = label

    elif _type == 'shap_wrapper':
        _global_checks.global_check_import('shap', 'SHAP explanations')
        _model_parts = ShapWrapper('model_parts')
        if isinstance(N, int):
            if isinstance(random_state, int):
                np.random.seed(random_state)
            N = min(N, self.data.shape[0])
            I = np.random.choice(np.arange(self.data.shape[0]), N, replace=False)
            _new_observation = self.data.iloc[I, :]
        else:
            _new_observation = self.data

        _model_parts.fit(self, _new_observation, **kwargs)
    else:
        raise TypeError("Wrong type parameter");

    return _model_parts
def model_performance(self, model_type=None, cutoff=0.5, label=None)-
Calculate model-level model performance measures
Parameters
model_type:{'regression', 'classification', None}- Model task type that is used to choose the proper performance measures
(default is
None, which means try to extract from themodel_typeattribute). cutoff:float, optional- Cutoff for predictions in classification models. Needed for measures like
recall, precision, acc, f1 (default is
0.5). label:str, optional- Name to appear in result and plots. Overrides default.
Returns
ModelPerformance class object- Explanation object containing the main result attribute and the plot method.
Notes
Expand source code Browse git
def model_performance(self,
                      model_type=None,
                      cutoff=0.5,
                      label=None):
    """Calculate model-level model performance measures

    Parameters
    -----------
    model_type : {'regression', 'classification', None}
        Model task type that is used to choose the proper performance measures
        (default is `None`, which means try to extract from the `model_type` attribute).
    cutoff : float, optional
        Cutoff for predictions in classification models. Needed for measures like
        recall, precision, acc, f1 (default is `0.5`).
    label : str, optional
        Name to appear in result and plots. Overrides default.

    Returns
    -----------
    ModelPerformance class object
        Explanation object containing the main result attribute and the plot method.

    Notes
    --------
    - https://pbiecek.github.io/ema/modelPerformance.html
    """

    checks.check_data_again(self.data)
    checks.check_y_again(self.y)

    if model_type is None and self.model_type is None:
        raise TypeError("if self.model_type is None, then model_type must be not None")
    elif model_type is None:
        model_type = self.model_type

    _model_performance = ModelPerformance(
        model_type=model_type,
        cutoff=cutoff
    )
    _model_performance.fit(self)

    if label:
        _model_performance.result['label'] = label

    return _model_performance
def model_profile(self, type=('partial', 'accumulated', 'conditional'), N=300, variables=None, variable_type='numerical', groups=None, span=0.25, grid_points=101, variable_splits=None, variable_splits_type='uniform', center=True, label=None, processes=1, random_state=None, verbose=True)-
Calculate model-level variable profiles as Partial or Accumulated Dependence
Parameters
type:{'partial', 'accumulated', 'conditional'}- Type of model profiles
(default is
'partial'for Partial Dependence Profiles). N:int, optional- Number of observations that will be sampled from the
dataattribute before the calculation of variable profiles.Nonemeans alldata(default is300). variables:strorarray_likeofstr, optional- Variables for which the profiles will be calculated
(default is
None, which means all of the variables). variable_type:{'numerical', 'categorical'}- Calculate the profiles for numerical or categorical variables
(default is
'numerical'). groups:strorarray_likeofstr, optional- Names of categorical variables that will be used for profile grouping
(default is
None, which means no grouping). span:float, optional- Smoothing coefficient used as sd for gaussian kernel (default is
0.25). grid_points:int, optional- Maximum number of points for profile calculations (default is
101). NOTE: The final number of points may be lower thangrid_points, e.g. if there is not enough unique values for a given variable. variable_splits:dictoflists, optional- Split points for variables e.g.
{'x': [0, 0.2, 0.5, 0.8, 1], 'y': ['a', 'b']}(default isNone, which means that they will be distributed uniformly). variable_splits_type:{'uniform', 'quantiles'}, optional- Way of calculating
variable_splits. Set 'quantiles' for percentiles. (default is'uniform', which means uniform grid of points). center:bool, optional- Theoretically Accumulated Profiles start at
0, but are centered to compare them with Partial Dependence Profiles (default isTrue, which means center around the averagey_hatcalculated on the data sample). label:str, optional- Name to appear in result and plots. Overrides default.
processes:int, optional- Number of parallel processes to use in calculations. Iterated over
variables(default is1, which means no parallel computation). random_state:int, optional- Set seed for random number generator (default is random seed).
verbose:bool, optional- Print tqdm progress bar (default is
True).
Returns
AggregatedProfiles class object- Explanation object containing the main result attribute and the plot method.
Notes
Expand source code Browse git
def model_profile(self,
                  type=('partial', 'accumulated', 'conditional'),
                  N=300,
                  variables=None,
                  variable_type='numerical',
                  groups=None,
                  span=0.25,
                  grid_points=101,
                  variable_splits=None,
                  variable_splits_type='uniform',
                  center=True,
                  label=None,
                  processes=1,
                  random_state=None,
                  verbose=True):

    """Calculate model-level variable profiles as Partial or Accumulated Dependence

    Parameters
    -----------
    type : {'partial', 'accumulated', 'conditional'}
        Type of model profiles
        (default is `'partial'` for Partial Dependence Profiles).
    N : int, optional
        Number of observations that will be sampled from the `data` attribute before
        the calculation of variable profiles. `None` means all `data` (default is `300`).
    variables : str or array_like of str, optional
        Variables for which the profiles will be calculated
        (default is `None`, which means all of the variables).
    variable_type : {'numerical', 'categorical'}
        Calculate the profiles for numerical or categorical variables
        (default is `'numerical'`).
    groups : str or array_like of str, optional
        Names of categorical variables that will be used for profile grouping
        (default is `None`, which means no grouping).
    span : float, optional
        Smoothing coefficient used as sd for gaussian kernel (default is `0.25`).
    grid_points : int, optional
        Maximum number of points for profile calculations (default is `101`).
        NOTE: The final number of points may be lower than `grid_points`,
        e.g. if there is not enough unique values for a given variable.
    variable_splits : dict of lists, optional
        Split points for variables e.g. `{'x': [0, 0.2, 0.5, 0.8, 1], 'y': ['a', 'b']}`
        (default is `None`, which means that they will be distributed uniformly).
    variable_splits_type : {'uniform', 'quantiles'}, optional
        Way of calculating `variable_splits`. Set 'quantiles' for percentiles.
        (default is `'uniform'`, which means uniform grid of points).
    center : bool, optional
        Theoretically Accumulated Profiles start at `0`, but are centered to compare
        them with Partial Dependence Profiles (default is `True`, which means center
        around the average `y_hat` calculated on the data sample).
    label : str, optional
        Name to appear in result and plots. Overrides default.
    processes : int, optional
        Number of parallel processes to use in calculations. Iterated over `variables`
        (default is `1`, which means no parallel computation).
    random_state : int, optional
        Set seed for random number generator (default is random seed).
    verbose : bool, optional
        Print tqdm progress bar (default is `True`).

    Returns
    -----------
    AggregatedProfiles class object
        Explanation object containing the main result attribute and the plot method.

    Notes
    --------
    - https://pbiecek.github.io/ema/partialDependenceProfiles.html
    - https://pbiecek.github.io/ema/accumulatedLocalProfiles.html
    """

    checks.check_data_again(self.data)

    types = ('partial', 'accumulated', 'conditional')
    aliases = {'pdp': 'partial', 'ale': 'accumulated'}
    _type = checks.check_method_type(type, types, aliases)

    _ceteris_paribus = CeterisParibus(
        grid_points=grid_points,
        variables=variables,
        variable_splits=variable_splits,
        variable_splits_type=variable_splits_type,
        processes=processes
    )

    if isinstance(N, int):
        if isinstance(random_state, int):
            np.random.seed(random_state)
        N = min(N, self.data.shape[0])
        I = np.random.choice(np.arange(self.data.shape[0]), N, replace=False)
        _y = self.y[I] if self.y is not None else self.y
        _new_observation = self.data.iloc[I, :]
    else:
        _y = self.y
        _new_observation = self.data

    _ceteris_paribus.fit(self, _new_observation, _y, verbose=verbose)

    _model_profile = AggregatedProfiles(
        type=_type,
        variables=variables,
        variable_type=variable_type,
        groups=groups,
        span=span,
        center=center,
        random_state=random_state
    )

    _model_profile.fit(_ceteris_paribus, verbose)

    if label:
        _model_profile.result['_label_'] = label

    return _model_profile
def model_surrogate(self, type=('tree', 'linear'), max_vars=5, max_depth=3, **kwargs)-
Create a surrogate interpretable model from the black-box model
This method uses the scikit-learn package to create a surrogate interpretable model (e.g. decision tree) from the black-box model. It aims to use the most important features and add a plot method to the model, so that it can be easily interpreted. See Notes section for references.
Parameters
type:{'tree', 'linear'}- Type of a surrogate model. This can be a decision tree or a linear model
(default is
'tree'). max_vars:int, optional- Maximum number of variables that will be used in surrogate model training.
These are the most important variables to the black-box model (default is
5). max_depth:int, optional- The maximum depth of the tree. If
None, then nodes are expanded until all leaves are pure or until all leaves contain less than min_samples_split samples (default is3for interpretable plot). kwargs:dict- Keyword arguments passed to one of the:
sklearn.tree.DecisionTreeClassifier,
sklearn.tree.DecisionTreeRegressor, sklearn.linear_model.LogisticRegression,
sklearn.linear_model.LinearRegression
Returns
One of: sklearn.tree.DecisionTreeClassifier, sklearn.tree.DecisionTreeRegressor, sklearn.linear_model.LogisticRegression, sklearn.linear_model.LinearRegressionA surrogate model with additional:-
plotmethodperformanceattributefeature_namesattributeclass_namesattribute
Notes
Expand source code Browse git
def model_surrogate(self,
                    type=('tree', 'linear'),
                    max_vars=5,
                    max_depth=3,
                    **kwargs):
    """Create a surrogate interpretable model from the black-box model

    This method uses the scikit-learn package to create a surrogate
    interpretable model (e.g. decision tree) from the black-box model.
    It aims to use the most important features and add a plot method to
    the model, so that it can be easily interpreted. See Notes section
    for references.

    Parameters
    -----------
    type : {'tree', 'linear'}
        Type of a surrogate model. This can be a decision tree or a linear model
        (default is `'tree'`).
    max_vars : int, optional
        Maximum number of variables that will be used in surrogate model training.
        These are the most important variables to the black-box model (default is `5`).
    max_depth : int, optional
        The maximum depth of the tree. If `None`, then nodes are expanded until all
        leaves are pure or until all leaves contain less than min_samples_split
        samples (default is `3` for interpretable plot).
    kwargs : dict
        Keyword arguments passed to one of the: `sklearn.tree.DecisionTreeClassifier,
        sklearn.tree.DecisionTreeRegressor, sklearn.linear_model.LogisticRegression,
        sklearn.linear_model.LinearRegression`


    Returns
    -----------
    One of: sklearn.tree.DecisionTreeClassifier, sklearn.tree.DecisionTreeRegressor, sklearn.linear_model.LogisticRegression, sklearn.linear_model.LinearRegression
    A surrogate model with additional:
        - `plot` method
        - `performance` attribute
        - `feature_names` attribute
        - `class_names` attribute

    Notes
    -----------
    - https://christophm.github.io/interpretable-ml-book/global.html
    - https://github.com/scikit-learn/scikit-learn
    """

    _global_checks.global_check_import('scikit-learn', 'surrogate models')
    checks.check_data_again(self.data)

    types = ('tree', 'linear')
    _type = checks.check_method_type(type, types)

    surrogate_model = utils.create_surrogate_model(explainer=self,
                                                   type=_type,
                                                   max_vars=max_vars,
                                                   max_depth=max_depth,
                                                   **kwargs)

    return surrogate_model
def predict(self, data)-
Make a prediction
This function uses the
predict_functionattribute.Parameters
data:pd.DataFrame, np.ndarray (2d)- Data which will be used to make a prediction.
Returns
np.ndarray (1d)- Model predictions for given
data.
Expand source code Browse git
def predict(self, data):
    """Make a prediction

    This function uses the `predict_function` attribute.

    Parameters
    ----------
    data : pd.DataFrame, np.ndarray (2d)
        Data which will be used to make a prediction.

    Returns
    ----------
    np.ndarray (1d)
        Model predictions for given `data`.
    """

    checks.check_method_data(data)

    return self.predict_function(self.model, data)
def predict_parts(self, new_observation, type=('break_down_interactions', 'break_down', 'shap', 'shap_wrapper'), order=None, interaction_preference=1, path='average', N=None, B=25, keep_distributions=False, label=None, processes=1, random_state=None, **kwargs)-
Calculate predict-level variable attributions as Break Down, Shapley Values or Shap Values
Parameters
new_observation:pd.Seriesornp.ndarray (1d)orpd.DataFrame (1,p)- An observation for which a prediction needs to be explained.
type:{'break_down_interactions', 'break_down', 'shap', 'shap_wrapper'}- Type of variable attributions (default is
'break_down_interactions'). order:listofintorstr, optional- Parameter specific for
break_down_interactionsandbreak_down. Use a fixed order of variables for attribution calculation. Use integer values or string variable names (default isNone, which means order by importance). interaction_preference:int, optional- Parameter specific for
break_down_interactionstype. Specify which interactions will be present in an explanation. The larger the integer, the more frequently interactions will be presented (default is1). path:listofint, optional- Parameter specific for
shap. If specified, then attributions for this path will be plotted (default is'average', which plots attribution means forBrandom paths). N:int, optional- Number of observations that will be sampled from the
dataattribute before the calculation of variable attributions. Default isNonewhich means alldata. B:int, optional- Parameter specific for
shap. Number of random paths to calculate variable attributions (default is25). keep_distributions:bool, optional- Save the distribution of partial predictions (default is
False). label:str, optional- Name to appear in result and plots. Overrides default.
processes:int, optional- Parameter specific for
shap. Number of parallel processes to use in calculations. Iterated overB(default is1, which means no parallel computation). random_state:int, optional- Set seed for random number generator (default is random seed).
kwargs:dict- Used only for
'shap_wrapper'. Passshap_explainer_typeto specify, which Explainer shall be used:{'TreeExplainer', 'DeepExplainer', 'GradientExplainer', 'LinearExplainer', 'KernelExplainer'}<code> (default is </code>None, which automatically chooses an Explainer to use). Also keyword arguments passed to one of the:shap.TreeExplainer.shap_values, shap.DeepExplainer.shap_values, shap.GradientExplainer.shap_values, shap.LinearExplainer.shap_values, shap.KernelExplainer.shap_values. See https://github.com/slundberg/shap
Returns
BreakDown, ShaporShapWrapper class object- Explanation object containing the main result attribute and the plot method.
Object class, its attributes, and the plot method depend on the
typeparameter.
Notes
Expand source code Browse git
def predict_parts(self,
                  new_observation,
                  type=('break_down_interactions', 'break_down', 'shap', 'shap_wrapper'),
                  order=None,
                  interaction_preference=1,
                  path="average",
                  N=None,
                  B=25,
                  keep_distributions=False,
                  label=None,
                  processes=1,
                  random_state=None,
                  **kwargs):
    """Calculate predict-level variable attributions as Break Down, Shapley Values or Shap Values

    Parameters
    -----------
    new_observation : pd.Series or np.ndarray (1d) or pd.DataFrame (1,p)
        An observation for which a prediction needs to be explained.
    type : {'break_down_interactions', 'break_down', 'shap', 'shap_wrapper'}
        Type of variable attributions (default is `'break_down_interactions'`).
    order : list of int or str, optional
        Parameter specific for `break_down_interactions` and `break_down`. Use a fixed
        order of variables for attribution calculation. Use integer values  or string
        variable names (default is `None`, which means order by importance).
    interaction_preference : int, optional
        Parameter specific for `break_down_interactions` type. Specify which interactions
        will be present in an explanation. The larger the integer, the more frequently
        interactions will be presented (default is `1`).
    path : list of int, optional
        Parameter specific for `shap`. If specified, then attributions for this path
        will be plotted (default is `'average'`, which plots attribution means for
        `B` random paths).
    N : int, optional
        Number of observations that will be sampled from the `data` attribute before
        the calculation of variable attributions. Default is `None` which means all `data`.
    B : int, optional
        Parameter specific for `shap`. Number of random paths to calculate
        variable attributions (default is `25`).
    keep_distributions :  bool, optional
        Save the distribution of partial predictions (default is `False`).
    label : str, optional
        Name to appear in result and plots. Overrides default.
    processes : int, optional
        Parameter specific for `shap`. Number of parallel processes to use in calculations.
        Iterated over `B` (default is `1`, which means no parallel computation).
    random_state : int, optional
        Set seed for random number generator (default is random seed).
    kwargs : dict
        Used only for `'shap_wrapper'`. Pass `shap_explainer_type` to specify, which
        Explainer shall be used: `{'TreeExplainer', 'DeepExplainer', 'GradientExplainer',
        'LinearExplainer', 'KernelExplainer'}` (default is `None`, which automatically
        chooses an Explainer to use).
        Also keyword arguments passed to one of the: `shap.TreeExplainer.shap_values,
        shap.DeepExplainer.shap_values, shap.GradientExplainer.shap_values,
        shap.LinearExplainer.shap_values, shap.KernelExplainer.shap_values`.
        See https://github.com/slundberg/shap

    Returns
    -----------
    BreakDown, Shap or ShapWrapper class object
        Explanation object containing the main result attribute and the plot method.
        Object class, its attributes, and the plot method depend on the `type` parameter.

    Notes
    --------
    - https://pbiecek.github.io/ema/breakDown.html
    - https://pbiecek.github.io/ema/iBreakDown.html
    - https://pbiecek.github.io/ema/shapley.html
    - https://github.com/slundberg/shap
    """

    checks.check_data_again(self.data)

    types = ('break_down_interactions', 'break_down', 'shap', 'shap_wrapper')
    _type = checks.check_method_type(type, types)

    if isinstance(N, int):
        # temporarly overwrite data in the Explainer (fastest way)
        # at the end of predict_parts fix the Explainer (add original data)
        if isinstance(random_state, int):
            np.random.seed(random_state)
        N = min(N, self.data.shape[0])
        I = np.random.choice(np.arange(self.data.shape[0]), N, replace=False)
        from copy import deepcopy
        _data = deepcopy(self.data)
        self.data = self.data.iloc[I, :]

    if _type == 'break_down_interactions' or _type == 'break_down':
        _predict_parts = BreakDown(
            type=_type,
            keep_distributions=keep_distributions,
            order=order,
            interaction_preference=interaction_preference
        )
    elif _type == 'shap':
        _predict_parts = Shap(
            keep_distributions=keep_distributions,
            path=path,
            B=B,
            processes=processes,
            random_state=random_state
        )
    elif _type == 'shap_wrapper':
        _global_checks.global_check_import('shap', 'SHAP explanations')
        _predict_parts = ShapWrapper('predict_parts')
    else:
        raise TypeError("Wrong type parameter.")

    _predict_parts.fit(self, new_observation, **kwargs)

    if label:
        _predict_parts.result['label'] = label

    if isinstance(N, int):
        self.data = _data

    return _predict_parts
def predict_profile(self, new_observation, type=('ceteris_paribus',), y=None, variables=None, grid_points=101, variable_splits=None, variable_splits_type='uniform', variable_splits_with_obs=True, processes=1, label=None, verbose=True)-
Calculate predict-level variable profiles as Ceteris Paribus
Parameters
new_observation:pd.DataFrameornp.ndarrayorpd.Series- Observations for which predictions need to be explained.
type:{'ceteris_paribus', TODO: 'oscilations'}- Type of variable profiles (default is
'ceteris_paribus'). y:pd.Seriesornp.ndarray (1d), optional- Target variable with the same length as
new_observation. variables:strorarray_likeofstr, optional- Variables for which the profiles will be calculated
(default is
None, which means all of the variables). grid_points:int, optional- Maximum number of points for profile calculations (default is
101). NOTE: The final number of points may be lower thangrid_points, eg. if there is not enough unique values for a given variable. variable_splits:dictoflists, optional- Split points for variables e.g.
{'x': [0, 0.2, 0.5, 0.8, 1], 'y': ['a', 'b']}(default isNone, which means that they will be calculated using one ofvariable_splits_typeand thedataattribute). variable_splits_type:{'uniform', 'quantiles'}, optional- Way of calculating
variable_splits. Set'quantiles'for percentiles. (default is'uniform', which means uniform grid of points). variable_splits_with_obs:bool, optional- Add variable values of
new_observationdata to thevariable_splits(default isTrue). label:str, optional- Name to appear in result and plots. Overrides default.
processes:int, optional- Number of parallel processes to use in calculations. Iterated over
variables(default is1, which means no parallel computation). verbose:bool, optional- Print tqdm progress bar (default is
True).
Returns
CeterisParibus class object- Explanation object containing the main result attribute and the plot method.
Notes
Expand source code Browse git
def predict_profile(self,
                    new_observation,
                    type=('ceteris_paribus',),
                    y=None,
                    variables=None,
                    grid_points=101,
                    variable_splits=None,
                    variable_splits_type='uniform',
                    variable_splits_with_obs=True,
                    processes=1,
                    label=None,
                    verbose=True):
    """Calculate predict-level variable profiles as Ceteris Paribus

    Parameters
    -----------
    new_observation : pd.DataFrame or np.ndarray or pd.Series
        Observations for which predictions need to be explained.
    type : {'ceteris_paribus', TODO: 'oscilations'}
        Type of variable profiles (default is `'ceteris_paribus'`).
    y : pd.Series or np.ndarray (1d), optional
        Target variable with the same length as `new_observation`.
    variables : str or array_like of str, optional
        Variables for which the profiles will be calculated
        (default is `None`, which means all of the variables).
    grid_points : int, optional
        Maximum number of points for profile calculations (default is `101`).
        NOTE: The final number of points may be lower than `grid_points`,
        eg. if there is not enough unique values for a given variable.
    variable_splits : dict of lists, optional
        Split points for variables e.g. `{'x': [0, 0.2, 0.5, 0.8, 1], 'y': ['a', 'b']}`
        (default is `None`, which means that they will be calculated using one of
        `variable_splits_type` and the `data` attribute).
    variable_splits_type : {'uniform', 'quantiles'}, optional
        Way of calculating `variable_splits`. Set `'quantiles'` for percentiles.
        (default is `'uniform'`, which means uniform grid of points).
    variable_splits_with_obs: bool, optional
        Add variable values of `new_observation` data to the `variable_splits`
        (default is `True`).
    label : str, optional
        Name to appear in result and plots. Overrides default.
    processes : int, optional
        Number of parallel processes to use in calculations. Iterated over `variables`
        (default is `1`, which means no parallel computation).
    verbose : bool, optional
        Print tqdm progress bar (default is `True`).

    Returns
    -----------
    CeterisParibus class object
        Explanation object containing the main result attribute and the plot method.

    Notes
    --------
    - https://pbiecek.github.io/ema/ceterisParibus.html
    """

    checks.check_data_again(self.data)

    types = ('ceteris_paribus',)
    _type = checks.check_method_type(type, types)

    if _type == 'ceteris_paribus':
        _predict_profile = CeterisParibus(
            variables=variables,
            grid_points=grid_points,
            variable_splits=variable_splits,
            variable_splits_type=variable_splits_type,
            variable_splits_with_obs=variable_splits_with_obs,
            processes=processes
        )
    else:
        raise TypeError("Wrong type parameter.")

    _predict_profile.fit(self, new_observation, y, verbose)

    if label:
        _predict_profile.result['_label_'] = label

    return _predict_profile
def predict_surrogate(self, new_observation, type='lime', **kwargs)-
Wrapper for surrogate model explanations
This function uses the lime package to create the model explanation. See https://lime-ml.readthedocs.io/en/latest/lime.html#module-lime.lime_tabular
Parameters
new_observation:pd.Seriesornp.ndarray (1d)orpd.DataFrame (1,p)- An observation for which a prediction needs to be explained.
type:{'lime'}- Type of explanation method
(default is
'lime', which uses the lime package to create an explanation). kwargs:dict- Keyword arguments passed to the lime.lime_tabular.LimeTabularExplainer object
and the LimeTabularExplainer.explain_instance method. Exceptions are:
training_data,mode,data_rowandpredict_fn. Other parameters: https://lime-ml.readthedocs.io/en/latest/lime.html#module-lime.lime_tabular
Returns
lime.explanation.Explanation- Explanation object.
Notes
Expand source code Browse git
def predict_surrogate(self,
                      new_observation,
                      type='lime',
                      **kwargs):
    """Wrapper for surrogate model explanations

    This function uses the lime package to create the model explanation.
    See https://lime-ml.readthedocs.io/en/latest/lime.html#module-lime.lime_tabular

    Parameters
    -----------
    new_observation : pd.Series or np.ndarray (1d) or pd.DataFrame (1,p)
        An observation for which a prediction needs to be explained.
    type : {'lime'}
        Type of explanation method
        (default is `'lime'`, which uses the lime package to create an explanation).
    kwargs : dict
        Keyword arguments passed to the lime.lime_tabular.LimeTabularExplainer object
        and the LimeTabularExplainer.explain_instance method. Exceptions are:
        `training_data`, `mode`, `data_row` and `predict_fn`. Other parameters:
        https://lime-ml.readthedocs.io/en/latest/lime.html#module-lime.lime_tabular

    Returns
    -----------
    lime.explanation.Explanation
        Explanation object.

    Notes
    -----------
    - https://github.com/marcotcr/lime
    """

    checks.check_data_again(self.data)

    if type == 'lime':
        _global_checks.global_check_import('lime', 'LIME explanations')
        _new_observation = checks.check_new_observation_lime(new_observation)
        _explanation = utils.create_lime_explanation(self, _new_observation, **kwargs)
    else:
        raise TypeError("Wrong 'type' parameter.")

    return _explanation
def residual(self, data, y)-
Calculate residuals
This function uses the
residual_functionattribute.Parameters
data:pd.DataFrame- Data which will be used to calculate residuals.
y:pd.Seriesornp.ndarray (1d)- Target variable which will be used to calculate residuals.
Returns
np.ndarray (1d)- Model residuals for given
dataandy.
Expand source code Browse git
def residual(self, data, y):
    """Calculate residuals

    This function uses the `residual_function` attribute.

    Parameters
    -----------
    data : pd.DataFrame
        Data which will be used to calculate residuals.
    y : pd.Series or np.ndarray (1d)
        Target variable which will be used to calculate residuals.

    Returns
    -----------
    np.ndarray (1d)
        Model residuals for given `data` and `y`.
    """

    checks.check_method_data(data)

    return self.residual_function(self.model, data, y)