Titanic example for xgboost
introduction to the topic: Explanatory Model Analysis: Explore, Explain, and Examine Predictive Models
Imports
import dalex as dx

import pandas as pd
import numpy as np

from sklearn.neural_network import MLPClassifier
from sklearn.preprocessing import StandardScaler, OneHotEncoder
from sklearn.impute import SimpleImputer
from sklearn.pipeline import Pipeline
from sklearn.compose import ColumnTransformer

import xgboost as xgb

import warnings
warnings.filterwarnings('ignore')

import plotly
plotly.offline.init_notebook_mode()
dx.__version__
Basic example with xgb.train
We will consider the most basic example first. Due to categorical variables in the dataset, that are not handled by default by xgb, we will drop them in the first example.
data = dx.datasets.load_titanic()

X = data.drop(columns='survived').loc[:, ['age', 'fare', 'sibsp', 'parch']]
y = data.survived
params = {
    "max_depth": 5,
    "objective": "binary:logistic",
    "eval_metric": "auc"
}

train = xgb.DMatrix(X, label=y)
classifier = xgb.train(params, train, verbose_eval=1)
Note that despite special data format needed by the xgb, you pass pandas.DataFrame to the Explainer. You have to use Data Frame in all interactions with the Explainer.
exp = dx.Explainer(classifier, X, y)
Again, note that X is just a Data Frame.
exp.predict(X)
exp.model_parts().plot()
Combining xgboost with sklearn's Pipeline - easy example
You can create more complex models with sklearn's Pipeline. We will use all data available now.
Using xgb.XGBClassifier or xgb.XGBRegressor class in Pipeline does not differs from any sklearn classifier.
However, using model in the Pipeline removes information about its class. Sometimes it may have absolutely no impact due to the same interface, though sometimes you have to pass information about inner model class (the one that actually makes a prediction) or create your own predict function with appropriate interface.
data = dx.datasets.load_titanic()

X = data.drop(columns='survived')
y = data.survived
numerical_features = ['age', 'fare', 'sibsp', 'parch']
numerical_transformer = Pipeline(
    steps=[
        ('imputer', SimpleImputer(strategy='median')),
        ('scaler', StandardScaler())
    ]
)

categorical_features = ['gender', 'class', 'embarked']
categorical_transformer = Pipeline(
    steps=[
        ('imputer', SimpleImputer(strategy='constant', fill_value='missing')),
        ('onehot', OneHotEncoder(handle_unknown='ignore'))
    ]
)

preprocessor = ColumnTransformer(
    transformers=[
        ('num', numerical_transformer, numerical_features),
        ('cat', categorical_transformer, categorical_features)
    ]
)

clf = Pipeline(steps=[('preprocessor', preprocessor),
                      ('classifier', xgb.XGBClassifier())])
clf.fit(X, y)
exp = dx.Explainer(clf, X, y)
exp.model_performance(model_type='classification').plot(geom='roc')
exp.model_parts().plot()
Non standard use
Explainer needs to know how the predictions are made. Its constructor tries to find out it by itself. However, it is not always possible. For example, if your model is wrapped with something unknown, with nonstandard behaviour you have to tell how to treat this model.
The easiest way is to pass model_class parameter telling what's the model actual interface.
Easy (and a bit fake) example
This example has no use, though it is easy to understand and use as a framework for more practical examples.
class Wrapper:
    def __init__(self, model):
        self.model = model

    def predict(self, dmatrix):
        return self.model.predict(dmatrix)
params = {
    "max_depth": 5,
    "objective": "binary:logistic",
    "eval_metric": "auc"
}

data = dx.datasets.load_titanic()

X = data.drop(columns='survived').loc[:, ['age', 'fare', 'sibsp', 'parch']]
y = data.survived

train = xgb.DMatrix(X, label=y)
inner_model = xgb.train(params, train, verbose_eval=1)

wrapped = Wrapper(classifier)
type(inner_model)
type(wrapped)
Such model has non standard interface because it need DMatrix. Note that class of this model is __main__.Wrapper thus Explainer will use default predict methods, which causes an error.
exp = dx.Explainer(wrapped, X, y)
However the inner model: xgb.train is known to the Explainer so you can just inform it. You will get valid explainer that can be used normally from now on.
exp = dx.Explainer(wrapped, X, y, model_class='xgboost.core.Booster')
exp.model_profile().plot()
exp.model_info
exp.model_class
Easy (and a bit fake) example 2
If your base model is not known to the Explainer you can pass a special argument predict_function to tell how to handle it. We will use exactly the same fake model from the previous example.
class Wrapper:
    def __init__(self, model):
        self.model = model

    def predict(self, dmatrix):
        return self.model.predict(dmatrix)
params = {
    "max_depth": 5,
    "objective": "binary:logistic",
    "eval_metric": "auc"
}

data = dx.datasets.load_titanic()

X = data.drop(columns='survived').loc[:, ['age', 'fare', 'sibsp', 'parch']]
y = data.survived

train = xgb.DMatrix(X, label=y)
inner_model = xgb.train(params, train, verbose_eval=1)

wrapped = Wrapper(classifier)
exp = dx.Explainer(wrapped, X, y, predict_function=lambda m, d: m.predict(xgb.DMatrix(d)))
exp.predict_parts(X.iloc[44, :]).plot(min_max=[0,1])
exp.model_info
exp.model_class
Plots
This package uses plotly to render the plots:
- Install extentions to use
plotlyin JupyterLab: Getting Started Troubleshooting - Use
show=Falseparameter inplotmethod to returnplotly Figureobject - It is possible to edit the figures and save them
Resources - https://dalex.drwhy.ai/python
Introduction to the
dalexpackage: Titanic: tutorial and examplesKey features explained: FIFA20: explain default vs tuned model with dalex
How to use dalex with: xgboost, tensorflow, h2o (feat. autokeras, catboost, lightgbm)
More explanations: residuals, shap, lime
Introduction to the Fairness module in dalex
Introduction to the Aspect module in dalex
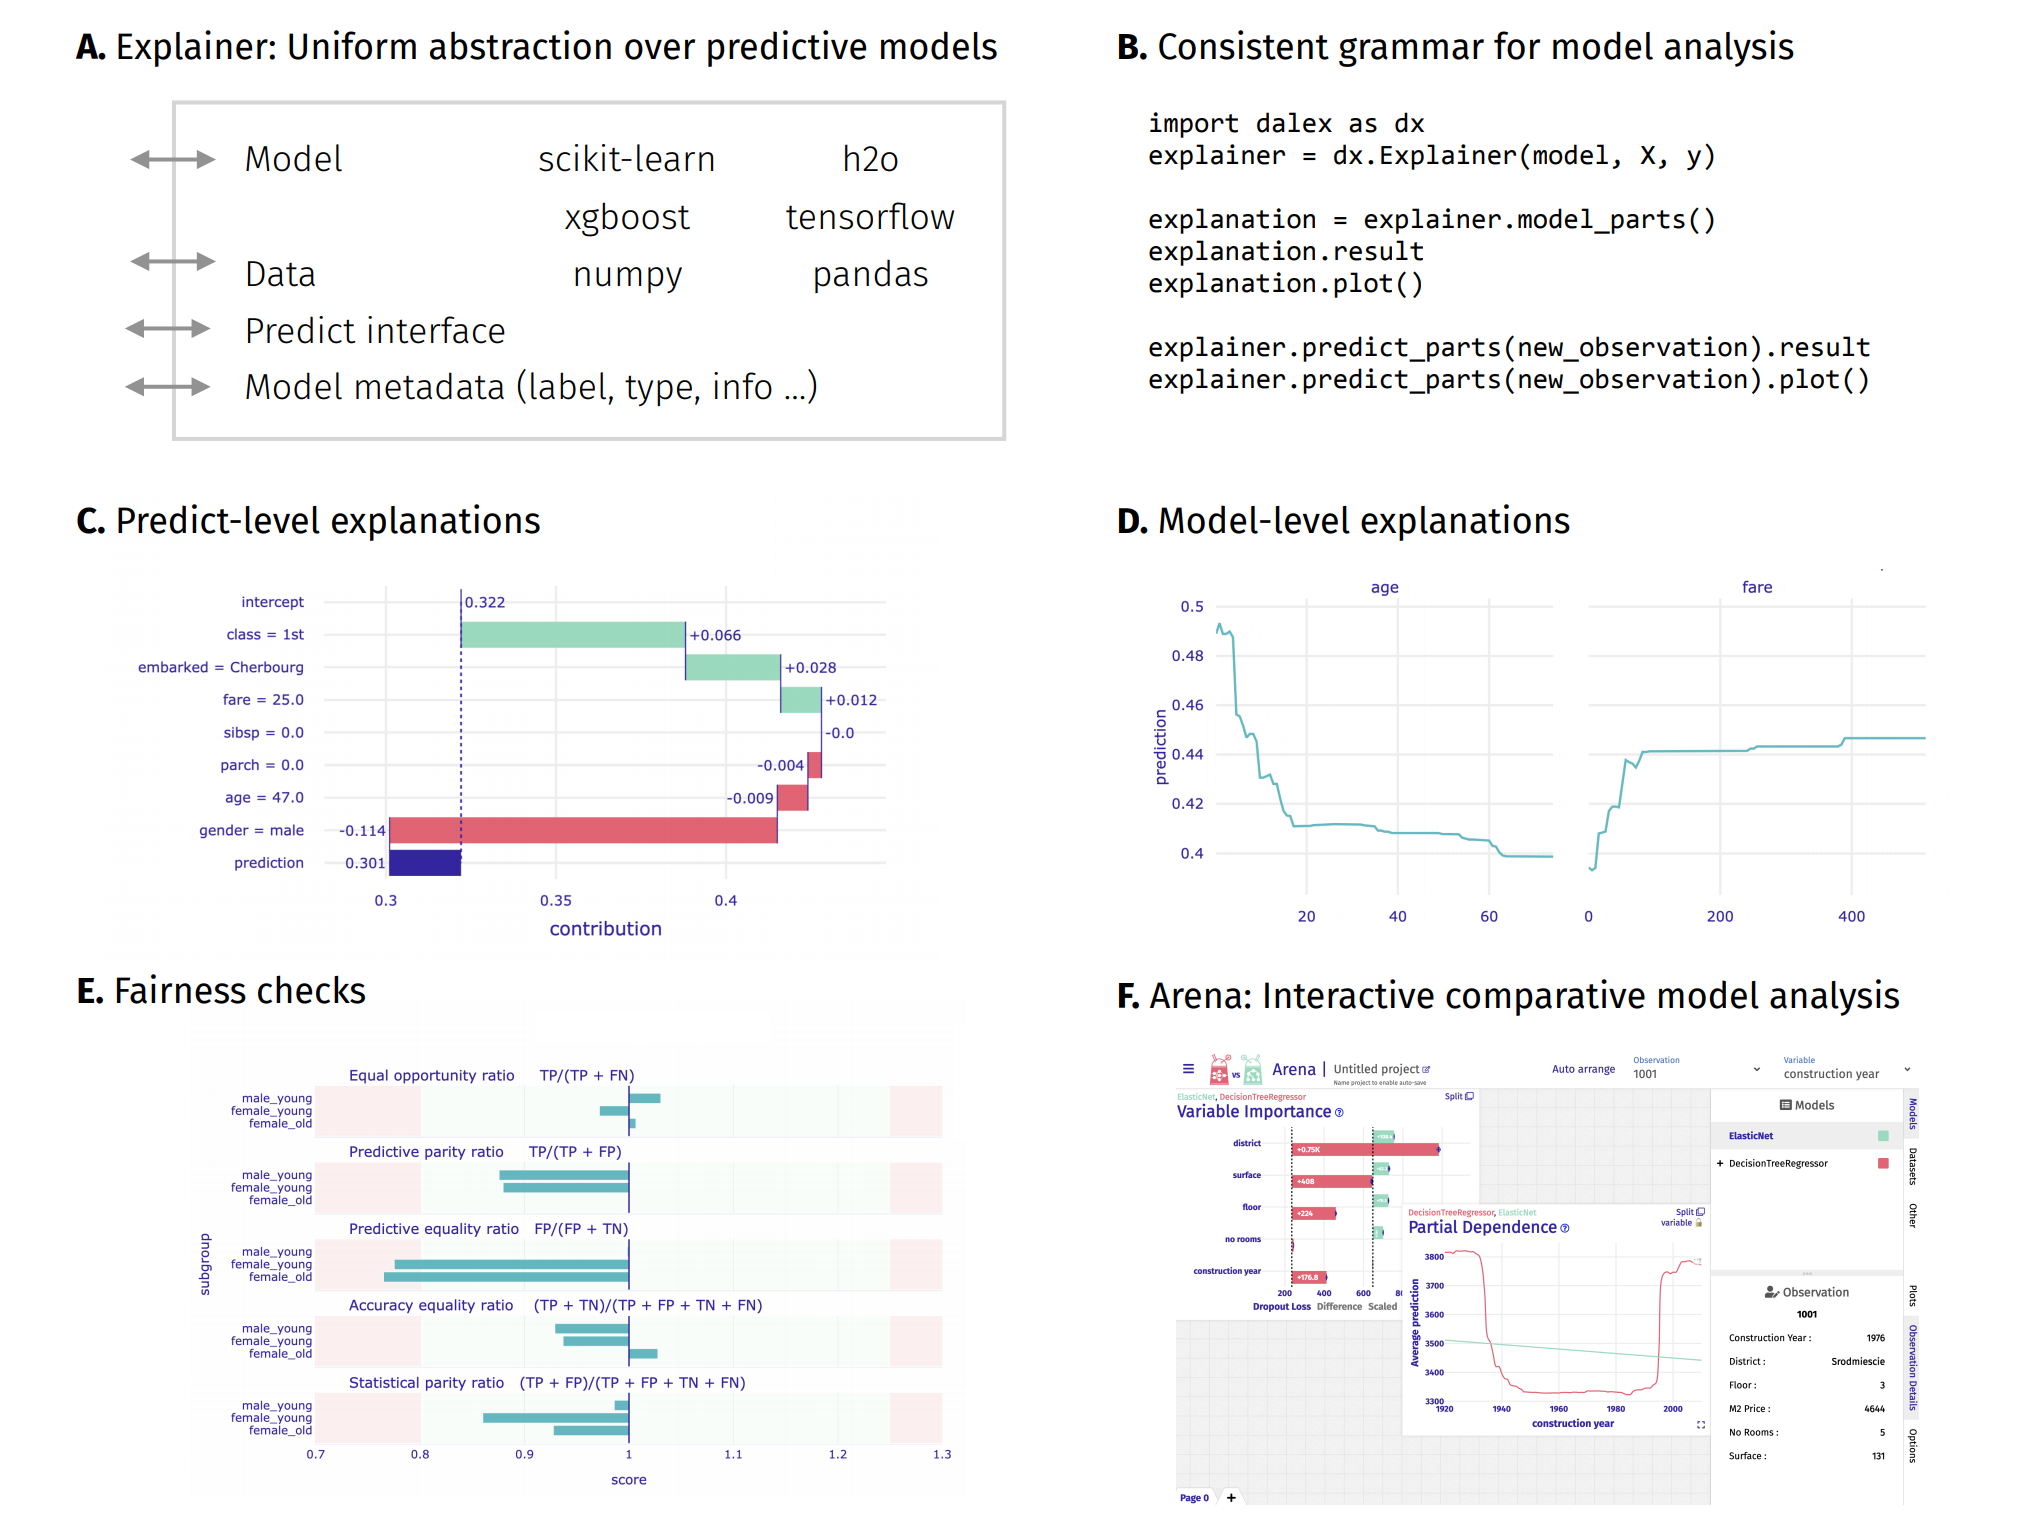
Introduction to Arena: interactive dashboard for model exploration
Code in the form of jupyter notebook
Changelog: NEWS
Theoretical introduction to the plots: Explanatory Model Analysis: Explore, Explain, and Examine Predictive Models