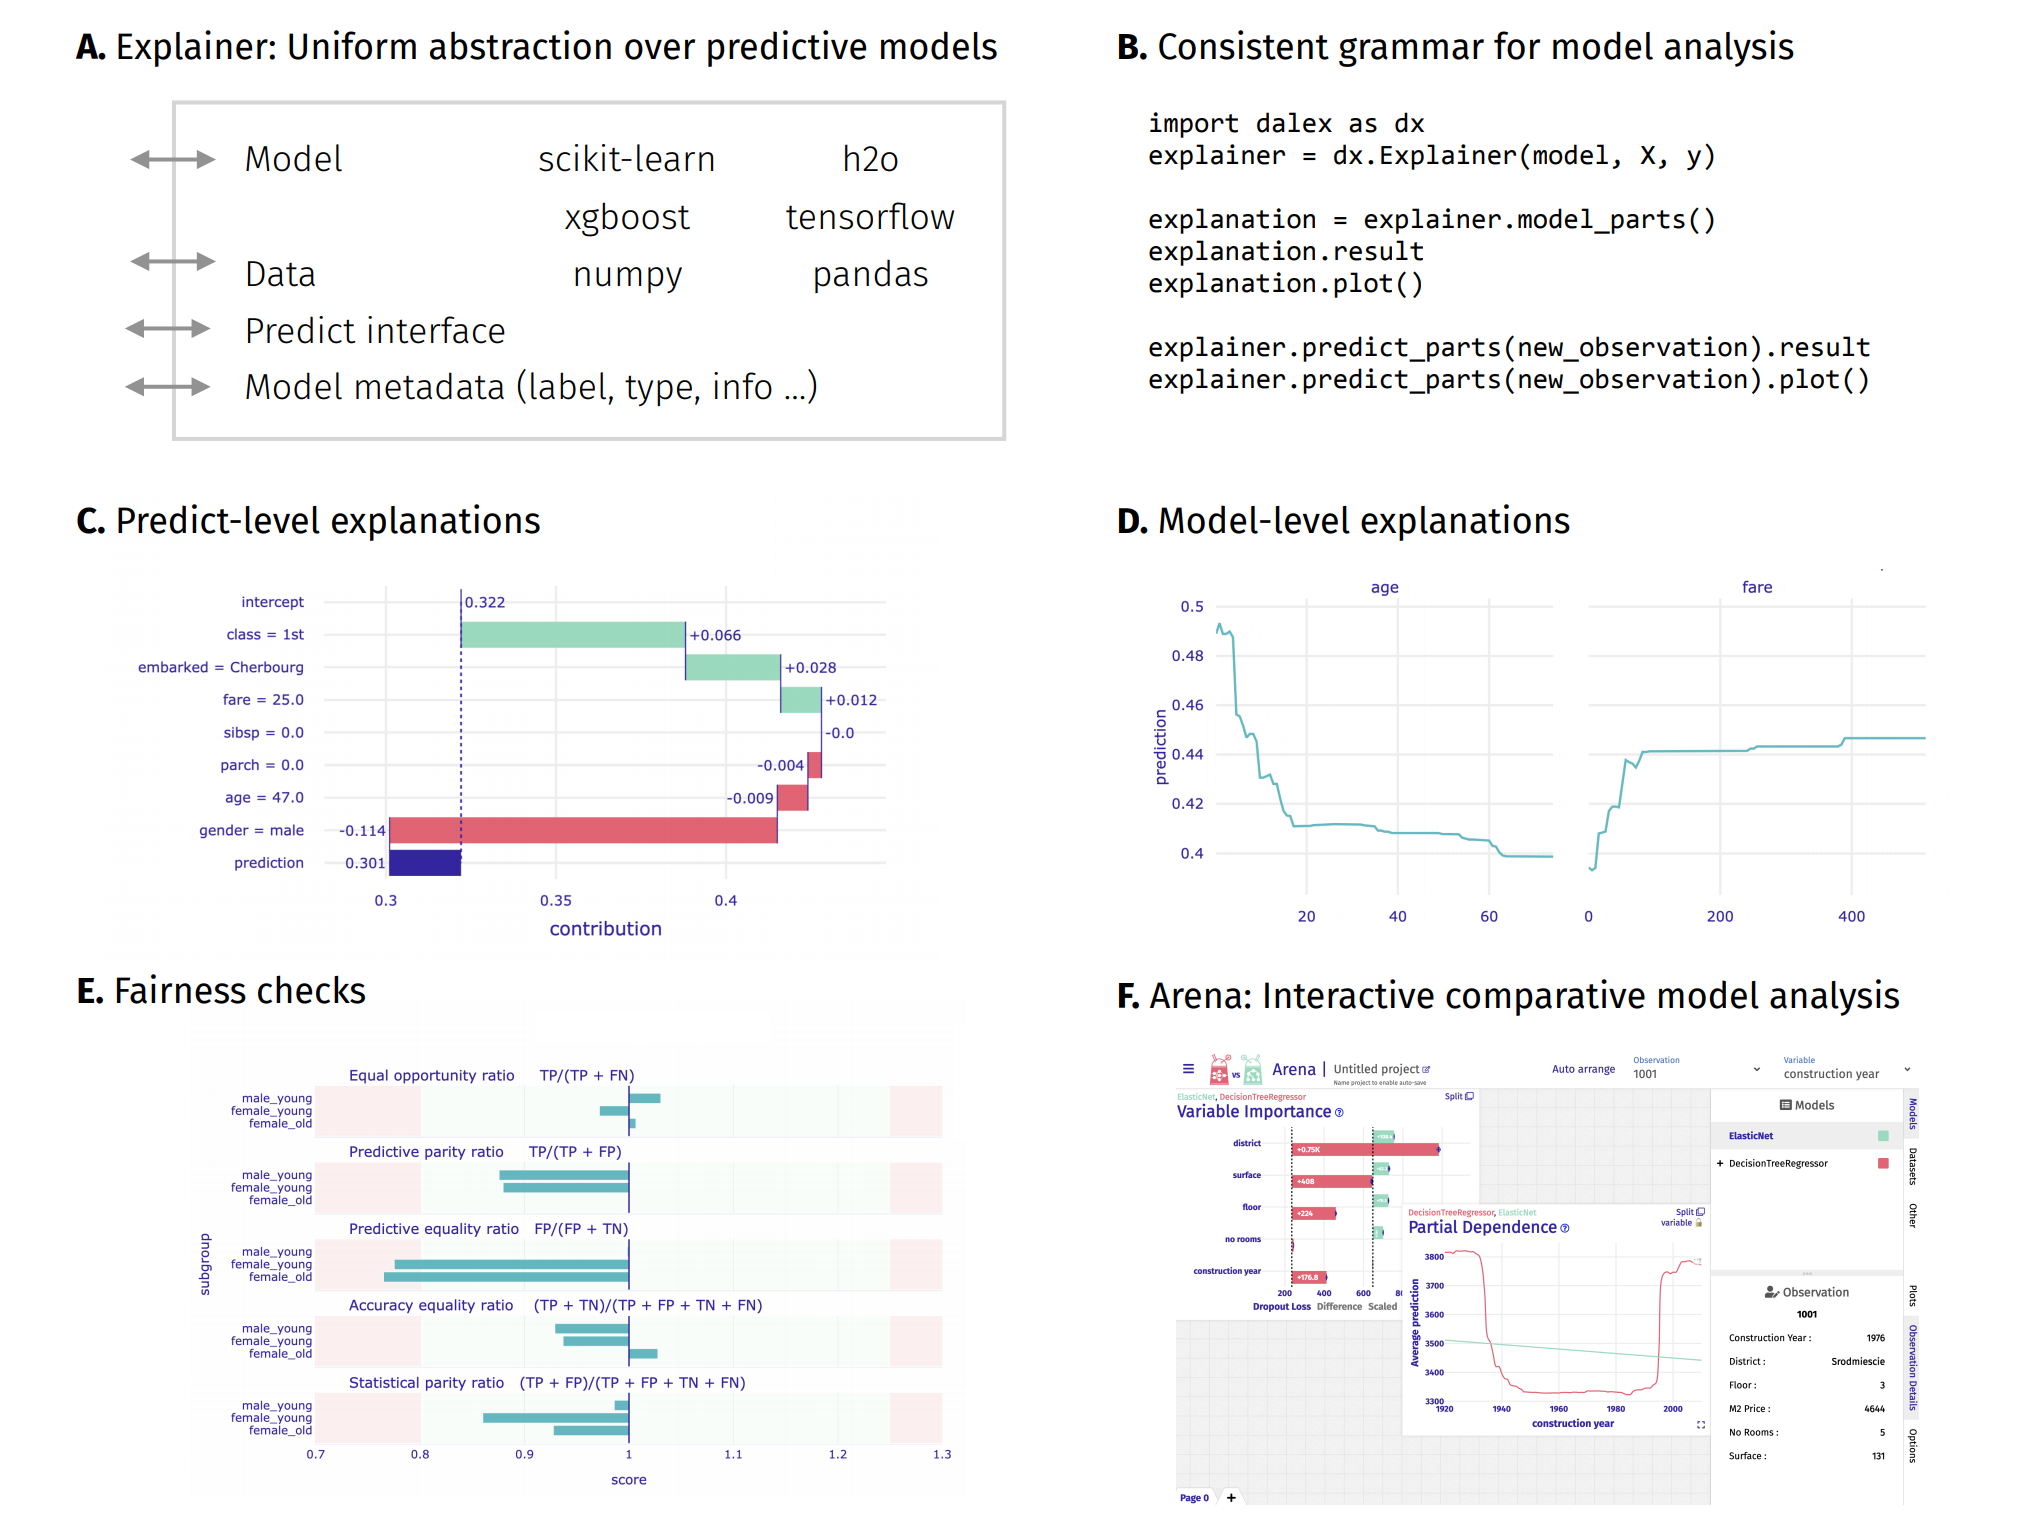
dalex - more explanations: residuals, shap, lime
imports
import dalex as dx
import numpy as np
import pandas as pd
from lightgbm import LGBMRegressor
from sklearn.svm import SVR
from sklearn.pipeline import Pipeline
from sklearn.preprocessing import StandardScaler
import plotly
plotly.offline.init_notebook_mode()
import warnings
warnings.filterwarnings('ignore')
dx.__version__
prepare data
Transform the skewed target variable (y) for better model fit.
data = dx.datasets.load_fifa()
X = data.drop(["nationality", "overall", "potential", "value_eur", "wage_eur"], axis = 1)
y = data['value_eur']
ylog = np.log(y)
create models
Use Pipeline to scale the data.
model_svm = Pipeline(steps=[('scale', StandardScaler()),
('model', SVR(C=10, epsilon=0.2, tol=1e-4))])
model_svm.fit(X, ylog)
model_gbm = LGBMRegressor(n_estimators=200, max_depth=10, learning_rate=0.15, random_state=0, verbose=-1)
model_gbm.fit(X, ylog)
predict_function
Because we transformed the the target, we want to change the default predict_function to return a real y value.
def predict_function(model, data):
return np.exp(model.predict(data))
create an explainer for the model
Explainer prints useful information, especially for resolving potential errors.
exp_svm = dx.Explainer(model_svm, data=X, y=y, predict_function=predict_function, label='svm')
exp_gbm = dx.Explainer(model_gbm, data=X, y=y, predict_function=predict_function, label='gbm')
model_performance allows for easy model comparison.
pd.concat((exp_svm.model_performance().result, exp_gbm.model_performance().result))
introduction to the topic: Explanatory Model Analysis: Explore, Explain, and Examine Predictive Models

Above functionalities are accessible from the Explainer object through its methods.
Model-level and predict-level methods return a new unique object that contains the result attribute (pandas.DataFrame) and the plot method.
Features
shap wrapper
predict_parts and model_parts have new type='shap_wrapper' which uses the shap package to produce shap values explanations.
pp = exp_gbm.predict_parts(X.iloc[[1]], type='shap_wrapper', shap_explainer_type="TreeExplainer")
type(pp)
pp.plot()
pp.result # shap_values
mp = exp_gbm.model_parts(type='shap_wrapper', shap_explainer_type="TreeExplainer")
type(mp)
mp.plot()
mp.plot(plot_type='bar')
mp.result # shap_values
model_diagnostics
New model_diagnostics method allows for Residual Diagnostics.
md_svm = exp_svm.model_diagnostics()
md_gbm = exp_gbm.model_diagnostics()
md_svm.plot(md_gbm, variable='age', yvariable='residuals', marker_size=5)
It can also be used for performing some Exploratory Dana Analysis.
md_svm.plot(variable='movement_reactions', yvariable='y', marker_size=5)
predict_surrogate
New predict_surrogate method uses the lime package to produce LIME explanations.
lime = exp_gbm.predict_surrogate(X.iloc[[1]])
type(lime)
lime.plot()
lime.result
model_surrogate
New model_surrogate method allows for creating Global Surrogate models. For type='tree' a DecisionTree is fitted, which has additional performance attribute and the plot method that uses the sklearn.tree.plot_tree function.
surrogate_model_small = exp_gbm.model_surrogate(type='tree', max_depth=3, max_vars=3)
surrogate_model_small.performance
surrogate_model_big = exp_gbm.model_surrogate(type='tree', max_depth=4, max_vars=4)
surrogate_model_big.performance
surrogate_model_small.plot(figsize=(20, 8), fontsize=10, filled=True)
surrogate_model_big.plot(figsize=(20, 10), fontsize=9)
type(surrogate_model_big)
plot profiles in PDP and ALE
pdp = exp_gbm.model_profile(variables=['age', 'movement_reactions', 'skill_ball_control', 'attacking_short_passing'],
N=100)
pdp.plot(geom='profiles')