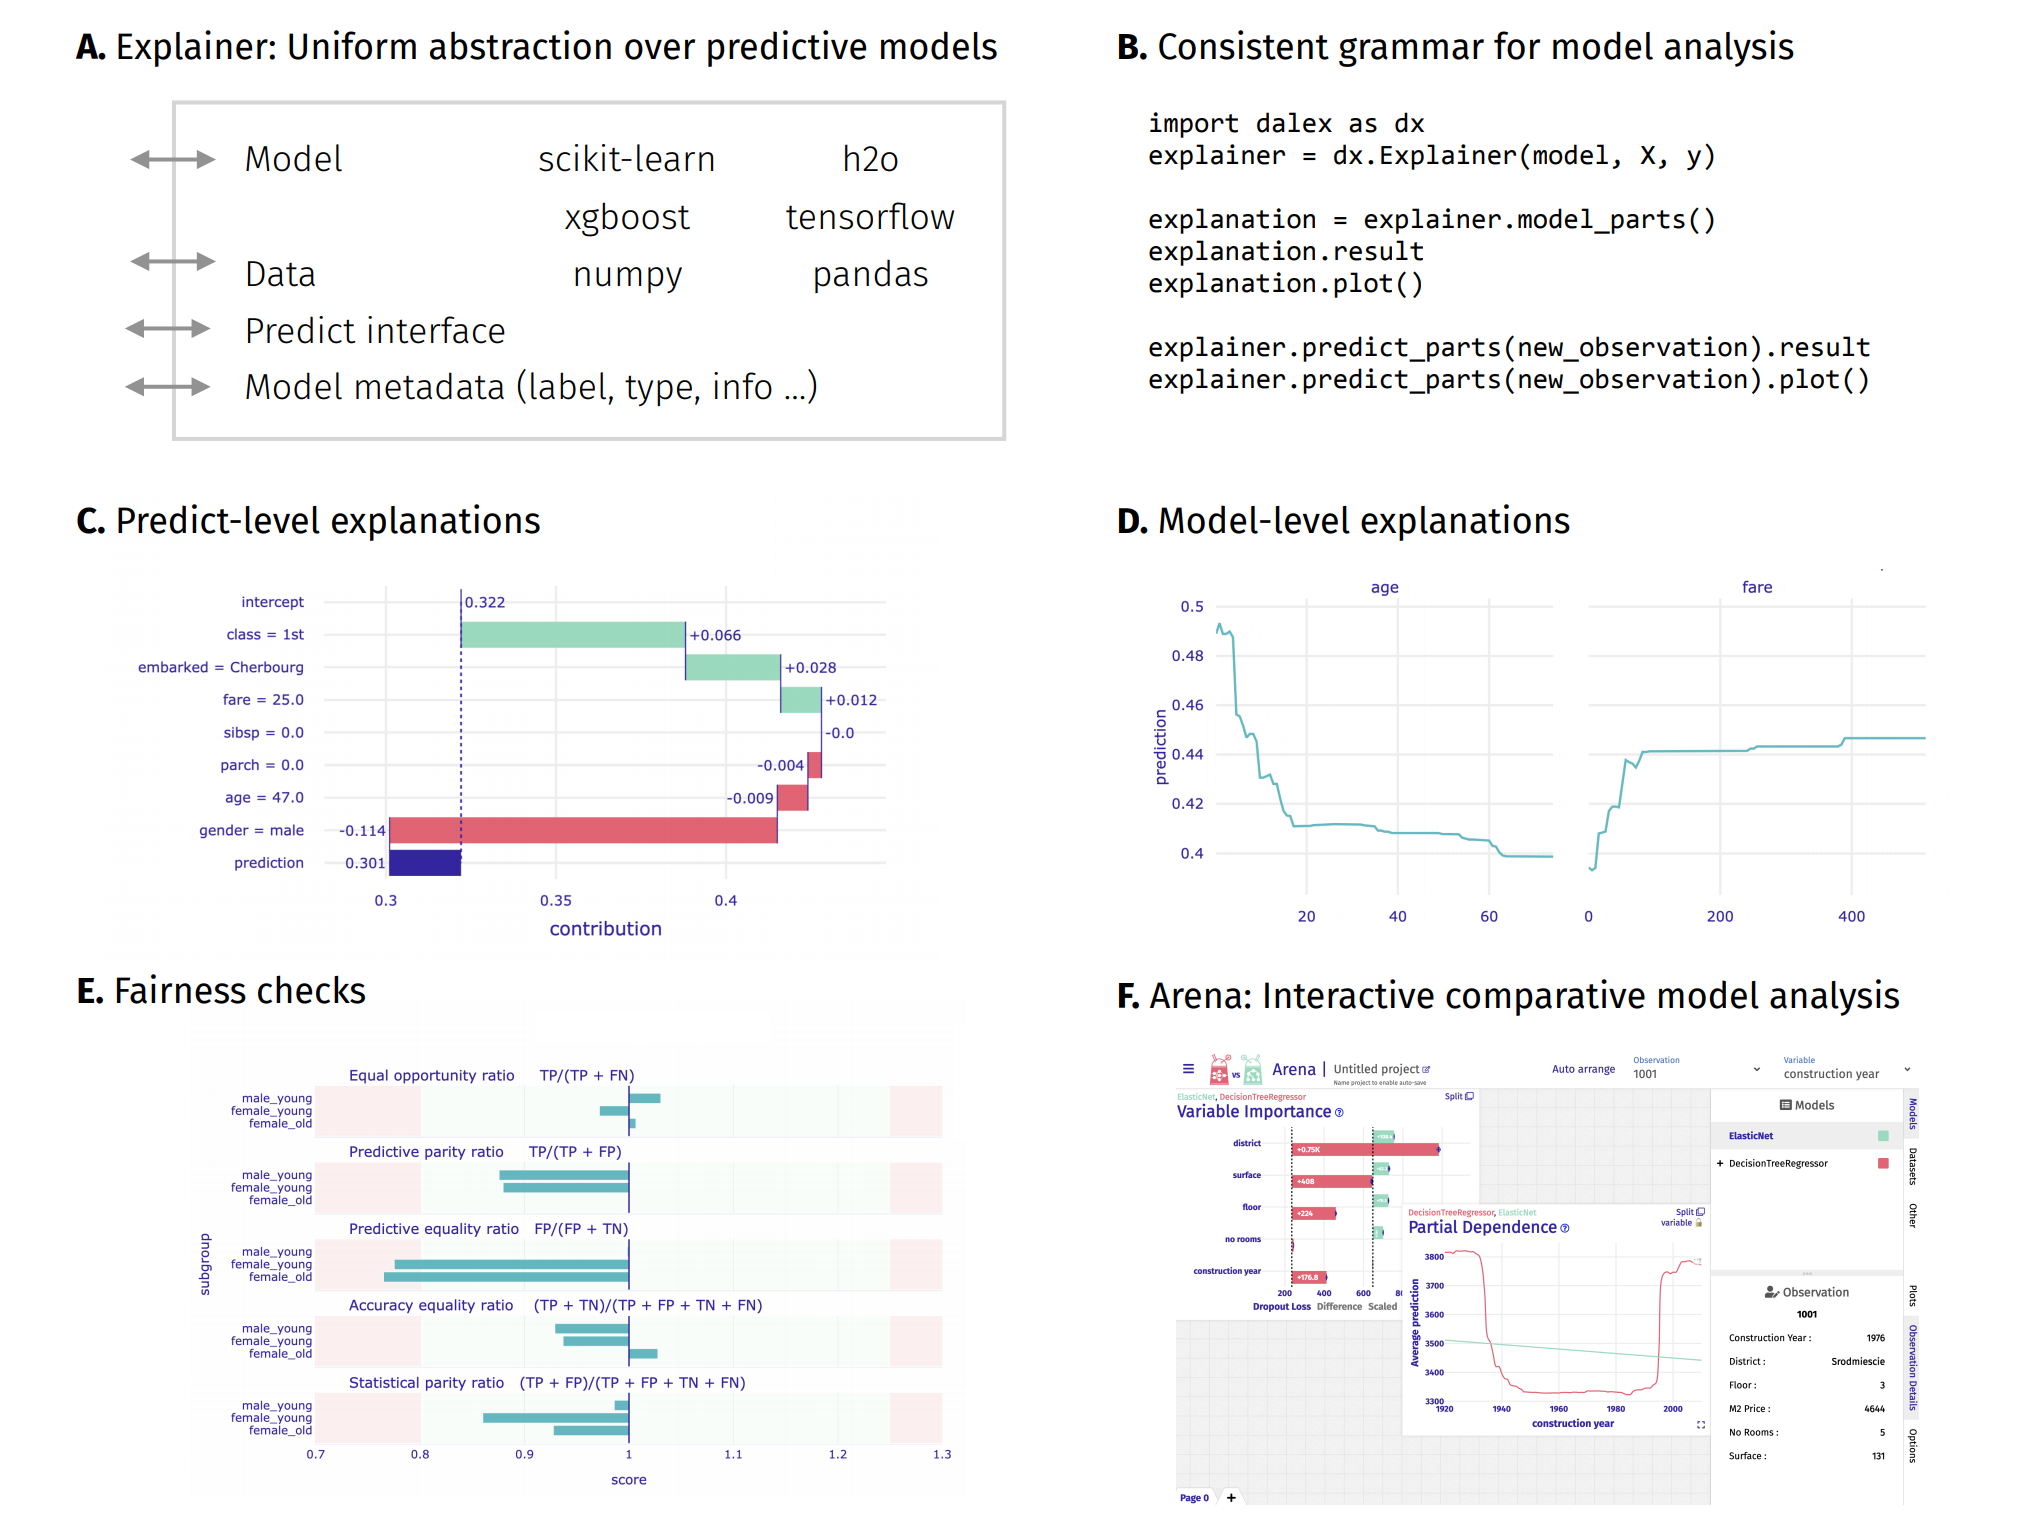
Compare various models with dalex ft. h2o, autokeras, catboost, lightgbm
introduction to the topic: Explanatory Model Analysis: Explore, Explain, and Examine Predictive Models

Health Insurance Cross Sell Prediction
https://www.kaggle.com/anmolkumar/health-insurance-cross-sell-prediction
In [1]:
import dalex as dx
import pandas as pd
import numpy as np
import sklearn
import tensorflow as tf
import autokeras as ak
import kerastuner as kt
import h2o
import catboost
import lightgbm
import warnings
warnings.filterwarnings('ignore')
In [2]:
# session info
pkg_dict = {}
for pkg in [dx, pd, np, sklearn, tf, ak, kt, h2o, catboost, lightgbm]:
pkg_dict[str.split(str(pkg))[1].replace("'", "")] = pkg.__version__
pd.DataFrame(pkg_dict, index=["version"])
Out[2]:
data
data (train.csv) from: https://www.kaggle.com/anmolkumar/health-insurance-cross-sell-prediction?select=train.csv
In [3]:
data = pd.read_csv("train.csv")
data.info()
data.head()
Out[3]:
We have 380k observations, 11 variables and binary target. For the purpose of this comparison, let's use 10% of the data.
Clean data:
remove
id,Policy_Sales_Channel,Region_Codeconvert
Vehicle_Ageto integerconvert
Gender,Vehicle_Damageto binaryinvestigate
Driving_License,Annual_Premium
In [4]:
from sklearn.model_selection import train_test_split
data, _ = train_test_split(data, train_size=0.1, random_state=1, stratify=data.Response)
In [5]:
# drop columns
data.drop(["id", "Region_Code", "Policy_Sales_Channel"], axis=1, inplace=True)
In [6]:
# convert three columns
print(data.Vehicle_Age.unique())
data.replace({'Gender': ["Male", "Female"], 'Vehicle_Damage': ["Yes", "No"], 'Vehicle_Age': data.Vehicle_Age.unique()},
{'Gender': [1, 0], 'Vehicle_Damage': [1, 0], 'Vehicle_Age': [2, 1, 0]},
inplace=True)
In [7]:
# what about Driving License in selling the vehicle insurance?
print(data.Driving_License.mean())
# 5% people bought the vehicle insurance without the Driving License
print(data.Response[data.Driving_License==0].mean())
# let's remove this variable for the clarity
# in the model we could assign: IF Driving_License == 0 THEN Response = 0
data.drop("Driving_License", axis=1, inplace=True)
In [8]:
# what about the distribution of Annual_Premium?
import matplotlib.pyplot as plt
_ = plt.hist(data.Annual_Premium, bins='auto', log=True)
plt.show()
In [9]:
# where is the peek?
print(data.Annual_Premium.min())
# a lot of the same values
print((data.Annual_Premium==data.Annual_Premium.min()).sum())
# some very big values (0.2% above 100k)
print((data.Annual_Premium>100000).sum() / data.shape[0])
In [10]:
# let's make a variable indicating the baseline, and move the annual premium
data = data.assign(
Annual_Premium_Baseline=lambda x: (x.Annual_Premium==data.Annual_Premium.min()).astype(int),
Annual_Premium=data.Annual_Premium-data.Annual_Premium.min()
)
# for the sake of this comparison, let's remove heavy outliers as well
data = data[data.Annual_Premium<100000-2630]
_ = plt.hist(data.Annual_Premium, bins='auto')
plt.show()
split
In [11]:
data.shape
Out[11]:
In [12]:
data.Response.mean() # uneven target
Out[12]:
In [13]:
X, y = data.drop("Response", axis=1), data.Response
X_train, X_test, y_train, y_test = train_test_split(X, y, test_size=0.25, random_state=1, stratify=y)
In [14]:
X_train.head()
Out[14]:
models
baseline
In [15]:
model_baseline = lightgbm.LGBMClassifier(boosting_type="dart", n_estimators=1000, is_unbalance=True)
model_baseline.fit(X_train, y_train)
exp_baseline = dx.Explainer(model_baseline, X_test, y_test, verbose=False, label="lgbm_dart")
exp_baseline.model_performance()
Out[15]:
h2o
In [ ]:
_ = h2o.init(nthreads=-1, max_mem_size=16)
h2o.no_progress()
In [17]:
df = h2o.H2OFrame(pd.concat([X_train, y_train], axis=1))
df.Response = df['Response'].asfactor()
model_h2o = h2o.estimators.H2ORandomForestEstimator(ntrees=1000,
nfolds=3,
balance_classes=True,
seed=1)
model_h2o.train(x=X_train.columns.to_list(),
y="Response",
training_frame=df)
In [18]:
exp_h2o = dx.Explainer(model_h2o, h2o.H2OFrame(X_test), y_test,
label="h2o_rf", model_type='classification', verbose=False)
exp_h2o.model_performance()
Out[18]:
autokeras
In [19]:
from sklearn.utils import class_weight
weights = dict(enumerate(class_weight.compute_class_weight(class_weight='balanced',
classes=y_train.unique(),
y=y_train)))
weights
Out[19]:
In [20]:
import logging
tf.get_logger().setLevel(logging.ERROR)
model_autokeras = ak.StructuredDataClassifier(
max_trials=5,
metrics=[
tf.keras.metrics.BinaryAccuracy(name='accuracy'),
tf.keras.metrics.Precision(name='precision'),
tf.keras.metrics.Recall(name='recall'),
tf.keras.metrics.AUC(name='auc')
],
num_classes= 2,
objective=kt.Objective("auc", direction="max"),
loss=tf.keras.losses.BinaryCrossentropy(from_logits = True),
tuner="random",
seed=1, overwrite=True
)
model_autokeras.fit(X_train, y_train, validation_split=0.25, class_weight=weights, epochs=20, verbose=0)
In [21]:
model_keras = model_autokeras.export_model()
model_keras.summary()
In [22]:
exp_keras = dx.Explainer(model=model_keras, data=X_test, y=y_test,
label="autokeras", model_type="classification", verbose=False)
exp_keras.model_performance()
Out[22]:
catboost
In [23]:
from sklearn.utils import class_weight
weights = dict(enumerate(class_weight.compute_class_weight(class_weight='balanced',
classes=y_train.unique(),
y=y_train)))
y_weights = y_train.replace(list(weights.keys()), list(weights.values()))
y_weights
Out[23]:
In [24]:
pool_train = catboost.Pool(X_train, y_train,
weight=y_weights)
model_catboost = catboost.CatBoostClassifier(iterations=2000)
model_catboost.fit(pool_train, verbose=False)
Out[24]:
In [25]:
exp_catboost = dx.Explainer(model_catboost, X_test, y_test, verbose=False, label="catboost")
exp_catboost.model_performance()
Out[25]:
comparison with dalex
In [26]:
# prepare list of Explainer objects
exp_list = [exp_baseline, exp_h2o, exp_keras, exp_catboost]
In this cross-selling task, the most important measures are precision & recall.
In [27]:
pd.concat([exp.model_performance().result for exp in exp_list])
Out[27]:
residual distribution
In [28]:
exp_list[0].model_performance().plot([exp.model_performance() for exp in exp_list[1:]])
In [29]:
exp_list[0].model_parts().plot([exp.model_parts() for exp in exp_list[1:]])
In [30]:
exp_list[0].model_profile(variable_splits_type="quantiles").plot(
[exp.model_profile(variable_splits_type="quantiles") for exp in exp_list[1:]],
variables=['Age', 'Annual_Premium', 'Vintage'],
title="Partial Dependence"
)
In [31]:
variables = ['Previously_Insured', 'Vehicle_Damage', 'Vehicle_Age']
variable_splits = {var: data[var].unique() for var in variables}
exp_list[0].model_profile(variable_splits=variable_splits).plot(
[exp.model_profile(variable_splits=variable_splits) for exp in exp_list[1:]],
variables=variables,
title="Partial Dependence",
geom="bars"
)
In [32]:
exp_list[0].model_profile(type='ale', variable_splits_type="quantiles").plot(
[exp.model_profile(type='ale', variable_splits_type="quantiles") for exp in exp_list[1:]],
variables=['Age', 'Annual_Premium', 'Vintage'], title="Accumulated Local Effects"
)
In [33]:
exp_list[0].model_diagnostics().plot([exp.model_diagnostics() for exp in exp_list[1:]],
variable="Age", yvariable="abs_residuals", N=5000, marker_size=5, line_width=4)
predict
In [34]:
new_observations = exp_baseline.data.iloc[0:10,]
pd.DataFrame({exp.label: exp.predict(new_observations) for exp in exp_list})
Out[34]:
In [35]:
new_observation = exp_baseline.data.iloc[[9]]
exp_list[0].predict_parts(new_observation, label=exp_list[0].label).plot(
[exp.predict_parts(new_observation, label=exp.label) for exp in exp_list[1:]],
min_max=[0, 1]
)
In [36]:
new_observation = exp_baseline.data.iloc[[9]]
exp_list[0].predict_profile(new_observation, variable_splits_type="quantiles", label=exp_list[0].label).plot(
[exp.predict_profile(new_observation, variable_splits_type="quantiles", label=exp.label) for exp in exp_list[1:]],
variables=['Age', 'Annual_Premium', 'Vintage']
)
In [37]:
new_observation = exp_baseline.data.iloc[[9]]
for exp in exp_list:
exp.predict_surrogate(new_observation).plot()
Plots
This package uses plotly to render the plots:
- Install extentions to use
plotlyin JupyterLab: Getting Started Troubleshooting - Use
show=Falseparameter inplotmethod to returnplotly Figureobject - It is possible to edit the figures and save them
Resources - https://dalex.drwhy.ai/python
- Introduction to the
dalexpackage: Titanic: tutorial and examples - Key features explained: FIFA20: explain default vs tuned model with dalex
- How to use dalex with: xgboost, tensorflow, h2o (feat. autokeras, catboost, lightgbm)
- More explanations: residuals, shap, lime
- Introduction to the Fairness module in dalex
- Introduction to the Arena: interactive dashboard for model exploration
- Code in the form of jupyter notebook
- Changelog: NEWS
- Theoretical introduction to the plots: Explanatory Model Analysis: Explore, Explain, and Examine Predictive Models
In [ ]: